Transducer on infinite baffle
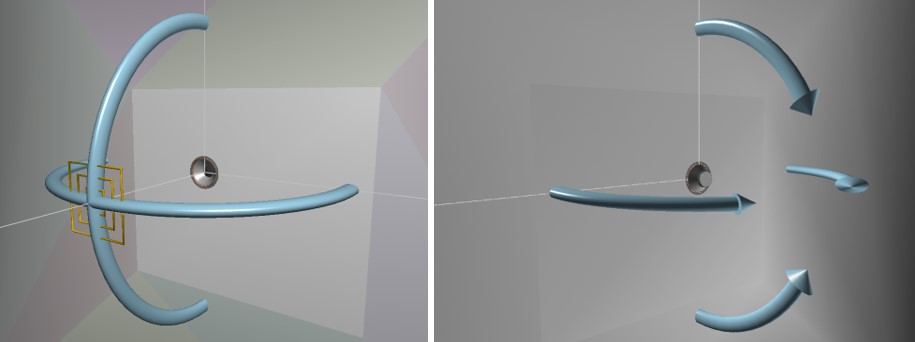
The transducer responses on infinite baffle are very important to make a correct loudspeaker simulation and design in the chosen acoustical domain.
In the datasheet the responses on infinite baffle can be found. Frequently, the SPL response at low frequencies isn’t correct as there is impact of the supplier measurement rooms. Sometimes the impedance curves show deviations as the transducers are measured by the supplier in large closed boxes.
Therefore, it is better to calculate the low frequency response of the transducer on infinite baffle with the TSP and merge these curves with the high frequency SPL response of the datasheet.
In the following chapters there will be explained how to create the transducer responses on infinite baffle in the most exact way. The available tools in VituixCAD are used.
Contents
- Datasheet
- Curve tracing SPL and impedance curves
- Make TSP model
- Compare SPL of TSP model and SPL curve of datasheet
- Merging SPL of TSP model and SPL curve of datasheet
Datasheet
The TSP (Thiele – Small Parameters), the SPL and the impedance curves, with the transducer without enclosure mounted on an infinite baffle, is used as the reference specification of a transducer. For most of the transducers these data are published in the datasheet.
The fundamental TSP parameters Sd, Mms, Cms, Rms, BL, Re and Le can be used to make a TSP model of the transducer.
The small signal parameters fs, Qes, Qms, Qts and Vas are calculated out of the fundamental parameters. The small signal parameters can be determined measuring the transducer impedance around the resonance frequency of the transducer.
The large signal parameters xmax, xmech, Pe and Vd are calculated parameters. They are useful to calculate the maximum performance of the loudspeaker system.
On our website the Thiele – Small parameters are described in more detail on Tech Page 05 – VCLLabs.
To make use of the datasheet responses while making the design, it is recommended to trace the SPL and impedance curves using VituixCAD SPLTrace tool. Afterwards the published data of the datasheet can be compared with measured data on IEC baffle and/or in enclosure.
Curve tracing SPL and impedance curves
The VituixCAD SPLTrace tool can be used to trace the SPL and impedance curves of the datasheet. Transducer Scanspeak 26W8534G00 is chosen for this example.
1. Screenshot
Make screenshots of the SPL and impedance curves of the datasheet and save them as .jpg files.
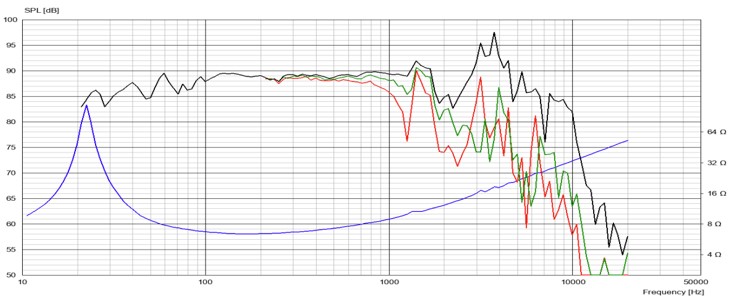
2. Trace
Start (VituixCAD->Tools->SPL Trace)
Open the jpg mage of the transducer datasheet in SPL Trace (SPL Trace -> Open Image)
Set SPL and Impedance Boundaries.
Set “Log Zaxis” on for logarithmic impedance scale.
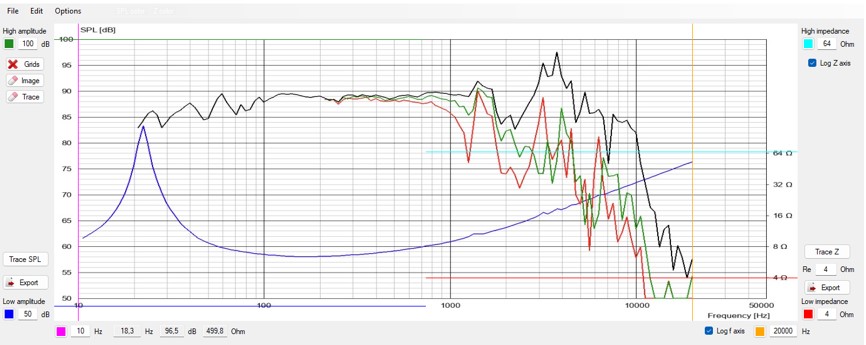
Click “Trace SPL” to select the SPL trace in red color and “Export” to a text file.
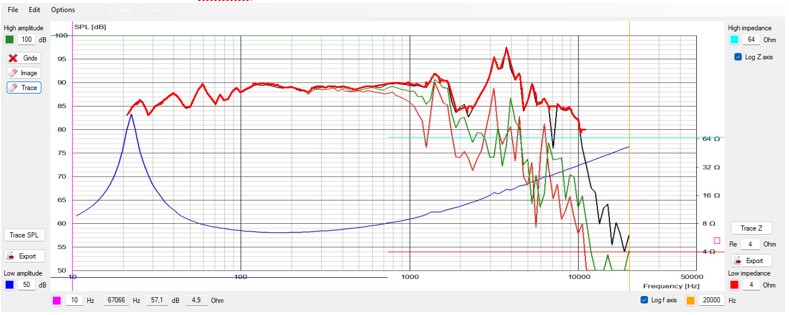
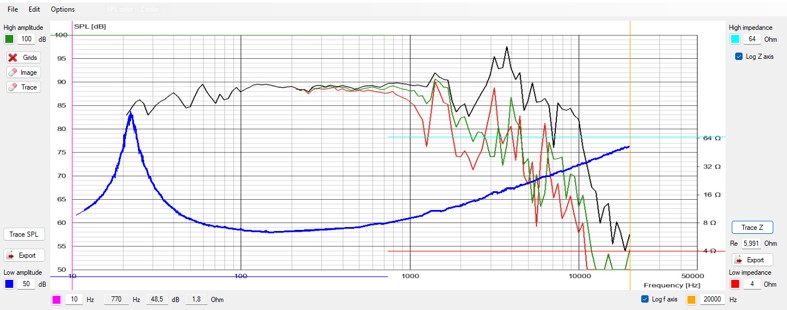
Click “Trace Z” to select the Impedance trace in blue color and “Export” to a text file.
Remark that after export the impedance values at 1 kHz and at 10 kHz are mentioned in a pop-up window. Make a notice of these values, because the values will be used to make the TSP model of the transducer.
Make TSP model
The SPL and impedance of the TSP model of a transducer are calculated using the TSP parameters including the voice coil inductance, but exclusive the cone break up. That means that the calculated SPL of a TSP model is correct at low frequencies up to the frequency where the cone starts breaking up.
So, it is possible to calculate/simulate the low frequency SPL of the transducer on infinite baffle. That is interesting, because the measured low frequency SPL published in the datasheet isn’t accurate in most cases. We can calculate the low frequency SPL response with the TSP of the datasheet and merge it with the high frequency SPL response of the datasheet.
The VituixCAD Enclosure tool can be used to realize a TSP model of a transducer.
Start (VituixCAD->Tools->SPL Enclosure)
Add new driver
Select “Add New driver”
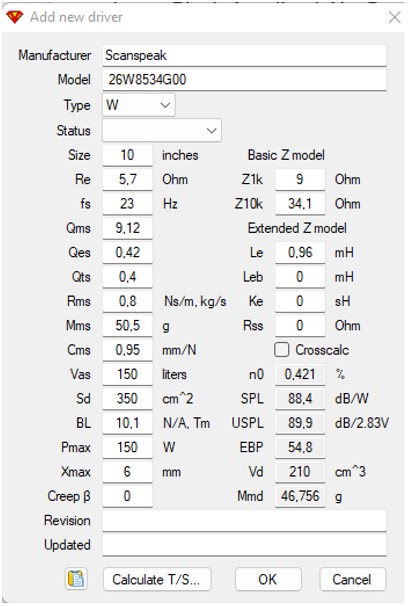
Fill in the pop-up chart for the Scanspeak woofer 26W8534G00.
The values of Z1k and Z10k are mentioned in the SPL Trace export of the impedance.
Select “OK”
Make TSP model
In the Enclosure window:
- Select radiator type: “infinite baffle”
- While cursor on SPL chart, select “show effect of inductance” with mouse right click.
- Choose: extra mass = 0.0 g; U = 2.83 Vrms; Rg = 0 Ohm
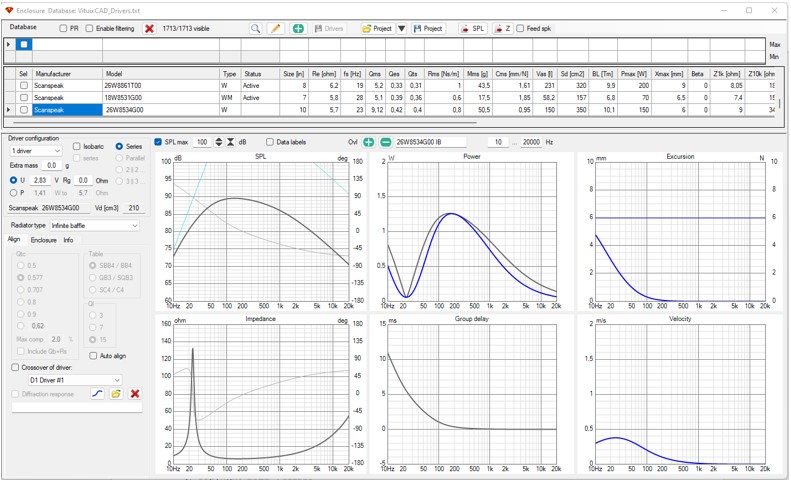
Curves of interest now are SPL and impedance charts.
Export SPL and impedance curves using the “SPL” and “Z” buttons on top of the Enclosure window. Save SPL and impedance curves to text files.
Compare SPL curve of TSP model and SPL curve of datasheet
Now we can compare the SPL curve of the TSP model and the SPL curve of the datasheet.
While cursor on SPL chart in Enclosure window, select “open overlay…” with mouse right click. Select the datasheet transducer SPL to open.
While cursor on SPL chart in Enclosure window, select “traces” with mouse right click. Only select trace “Total SPL 2pi” and trace”File: datasheet transducer SPL”
Now following SPL chart is displayed in the Enclosure window.
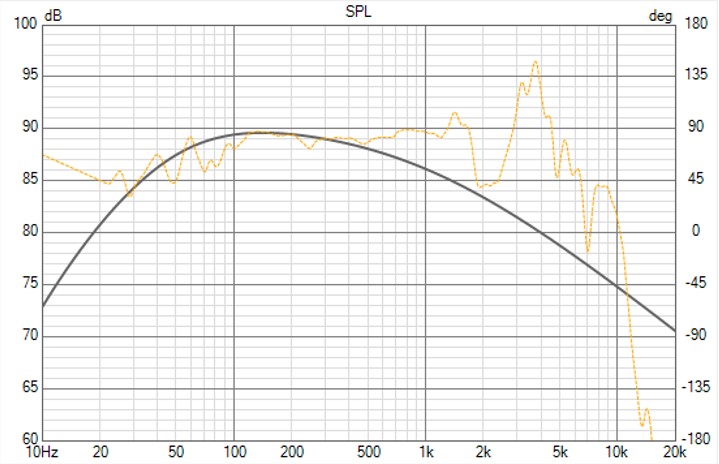
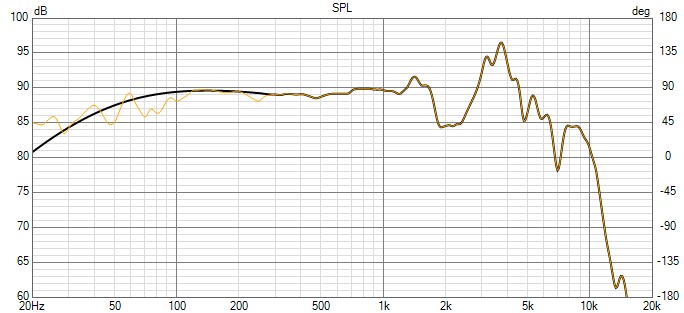
The SPL of the TSP model in black and the SPL of the datasheet in yellow.
Remark that the TSP model SPL is the mean value of the datasheet SPL below 300 Hz. Both curves can be merged at 300 Hz to realize a correct SPL on infinite baffle from low to high frequencies.
Merging SPL of TSP model and SPL curve of datasheet
The VituixCAD Merger tool can be used to realize a merged SPL curve for a transducer.
Start (VituixCAD->Tools->Merger)
For the Low frequency part in the window, open the SPL response of the TSP model.
Choose “no baffle loss”
For the High frequency part in the window, open the SPL response of the datasheet.
For the transition: set Frequency = 300 Hz and the blending bandwidth = ½ octave.
Choose “Show phase”.
For the output: choose “create merged response” and choose file extension “TXT”. Save the merged response to a text file.
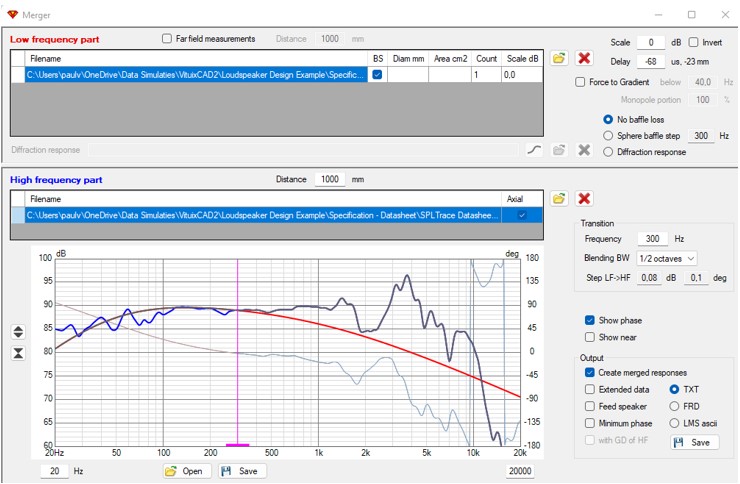
In the plot below, the merged SPL response of the transducer on infinite baffle is displayed in black color. The SPL datasheet curve in yellow color to compare with.
The merged response can replace the SPL response of the transducer datasheet. It is much more accurate at low frequencies and can be used for further design.
