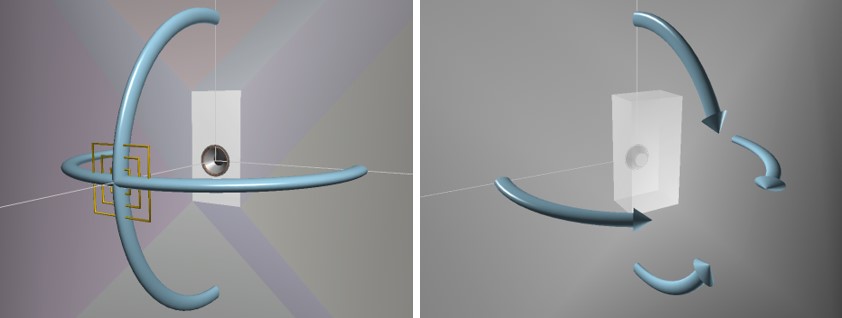
Transducer in enclosure on infinite baffle
There are different enclosure or radiator types: closed box, basreflex, passive radiator, dipole and others.
In this technical page we only consider the closed box enclosure. Other radiator types will be explained in separate technical pages.
The transducer placed in a closed box enclosure will have different SPL and impedance responses, all considered on infinite baffle.
At first the transducer TSP model on infinite baffle, as can be defined by a CAD tool, will be placed in the enclosure and the changes of SPL and impedance responses will be simulated. This SPL response will be compared with the transducer SPL response on infinite baffle, without the enclosure. By merging both SPL curves, the SPL response will become correct from low to high frequencies.
The VituixCAD Enclosure and the VituixCAD Merger tool can be used to calculate the responses.
Contents
- Transducer TSP model in enclosure – closed box radiator type
- Compare SPL of TSP model in enclosure and SPL of transducer, on infinite baffle
- Merge SPL of TSP model in enclosure and SPL of transducer, on infinite baffle
Transducer TSP model in enclosure – closed box radiator type
For this example, the Scanspeak 26W8534G00 in a closed box enclosure of 55 L, used in loudspeaker VCL EM2, is chosen. Damping material is added until the Qmc value becomes around 3.0.
Start (VituixCAD->Tools->SPL Enclosure)
In the Enclosure window:
- Select radiator type: “closed”
- While cursor on SPL chart, select “show effect of inductance” with mouse right click.
- Choose: extra mass = 0.0 g; U = 2.83 Vrms; Rg = 0 Ohm
- Choose Enclosure TAB (not the Align TAB) and set volume to 55 L, Qa = 7.0 and Ql = 3.0.
Under the Info TAB, a complete read out of the closed box system parameters is displayed.
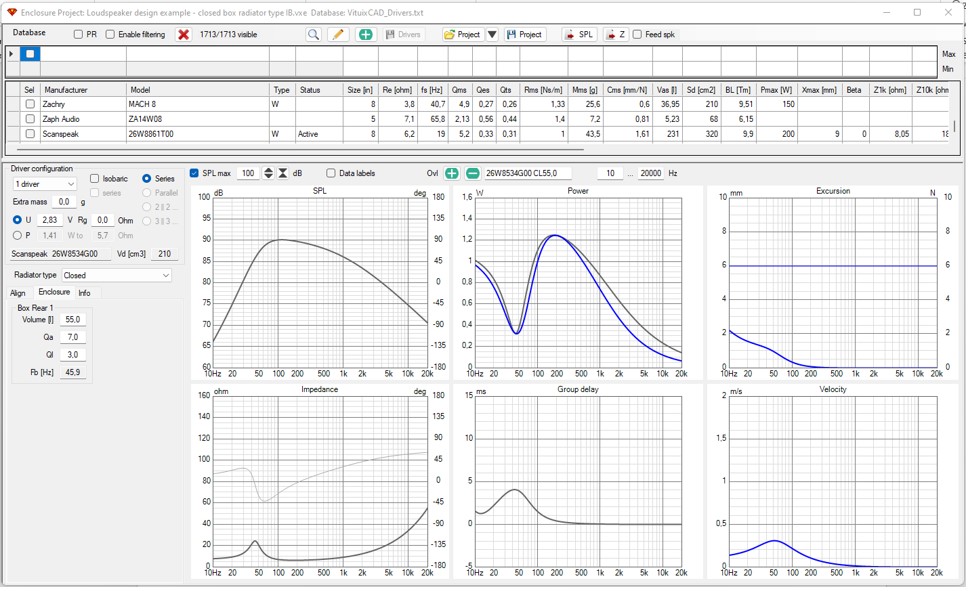
Curves of interest are SPL and impedance charts.
SPL and impedance curves can be exported as text files using the “SPL” and “Z” buttons on top of the Enclosure window.
Compare SPL of TSP model in enclosure and SPL of transducer, on infinite baffle
We can compare the SPL of the TSP model in enclosure on infinite baffle with the SPL of the transducer without enclosure on infinite baffle.
While cursor on SPL chart in Enclosure window, select “Open overlay…” with mouse right click. Select the SPL of the transducer on infinite baffle to open.
While cursor on SPL chart in Enclosure window, select “traces” with mouse right click. Only select trace “Total SPL 2pi” and the trace “SPL of the transducer on infinite baffle”.
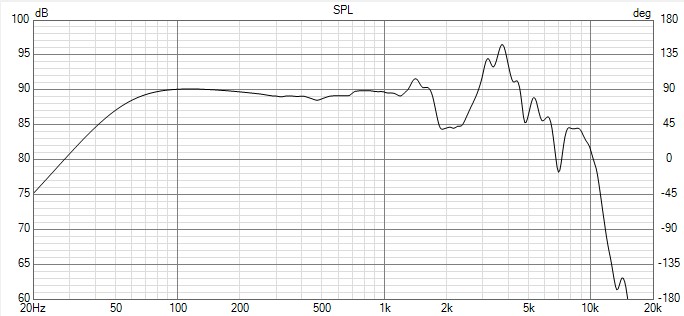
Now the following SPL chart is displayed in the Enclosure window.
The SPL of the TSP model in enclosure in black color and the SPL of the transducer on infinite baffle in yellow color.
Remark that the SPL of TSP model in the enclosure below 300 Hz is increased compared with the infinite baffle response. Both curves can be merged at 300 Hz to realize a correct SPL in enclosure on infinite baffle from low to high frequencies.
Merge SPL of TSP model in enclosure and SPL of transducer, on infinite baffle
Start (VituixCAD->Tools->SPL Merger)
For the Low frequency part in the window, open the SPL response of the TSP model in enclosure.
Choose “no baffle loss”
For the High frequency part in the window, open the SPL response of the transducer on infinite baffle.
For the transition: set Frequency = 300 Hz and the blending bandwidth = ½ octave.
Choose “Show phase”
For the output: choose “create merged response” and choose file extension “TXT”.
Save the merged response a txt file.
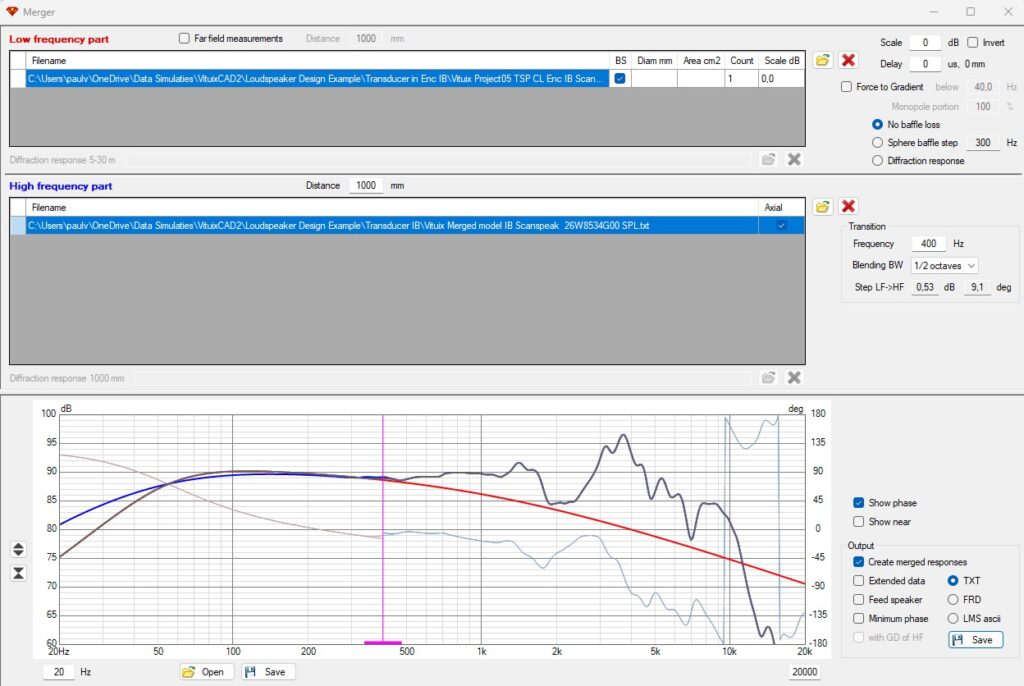
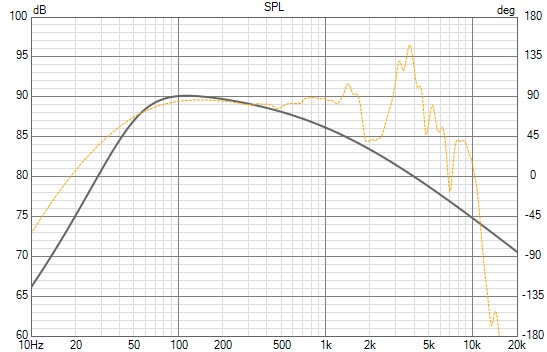
The merged SPL response of the transducer in enclosure on infinite baffle is displayed in the plot below. It can be used to design the transducer in enclosure in full space using the VituixCAD diffraction tool.