SPL off axis – Power and Directivity Index – full space

Contents
- Transducer directional behavior
- Power response and Directivity
- Simulation of Power and Directivity Index
Transducer directional behavior
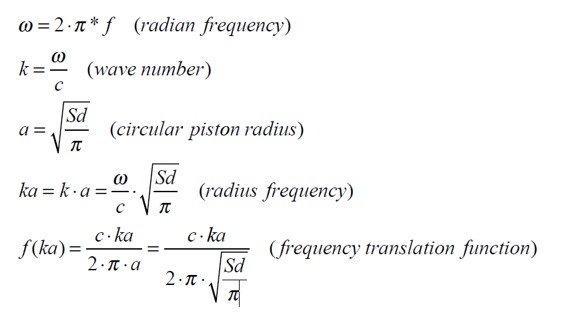
The characteristics of a transducer depend both on its size and the wavelength of sound it is radiating. Both the transducer size and frequency must be considered. The ka parameter is defined as the product of the wave number and piston radius.

The value of ka = 1 has a special significance. It marks the frequency where the wavelength equals the circumference of a circular source. It is also commonly thought of as the transition between nondirectional and directional radiation.
For the case of a 10 Inch woofer Scanspeak 26W8534G00, Sd = 350 cm2 , the ka=1 frequency is 520Hz. It means that above the ka = 1 frequency, the transducer radiation becomes more and more directional. This behavior can be observed in the off axis SPL fall off at higher frequencies.
Power response and Directivity
Power Response is a term commonly used to describe the total power radiated by the source in all directions. The power can be represented as a SPL curve of an omnidirectional point source with identical power.
The power can be calculated out of the SPL responses around the loudspeaker. Given a full set of frequency response measurements uniformly distributed on the surface of an imaginary sphere around the loudspeaker, the average power spectrum over all directions can be calculated.
Directivity is the ratio of the axial intensity over the intensity produced by a point source of identical power. This provides a means to relate axial pressure to a pressure curve representing power response.
Loudspeaker directivity is the extent to which the sound radiated by a loudspeaker is “focused” in a given direction. The directivity index (DI) spectrum is a well-known metric which quantifies loudspeaker directivity as a function of frequency. Given a full set of SPL response measurements uniformly distributed on the surface of an imaginary sphere around the loudspeaker, the full-sphere DI is defined as the ratio of the on-axis power spectrum over the average power spectrum over all directions. In the absence of a full set of measurements, however, two orbits (horizontal and vertical) of measurements around the loudspeaker are used to compute an approximate full-sphere DI.
Simulation of Power and Directivity Index
The VituixCAD Diffraction tool can be used to calculate power response and directivity index curves.
Start (VituixCAD->Tools->Diffraction)
Open a “vxb” baffle project for example of the Scanspeak 26W8534G00 transducer like used in Tech Page 10.
In the output window:
- set Full Space to “on”
- set Directivity to “on”
- set Vertical to “on”
- set Negative angles to “on”. If the transducer is placed not symmetric on the baffle with respect to the baffle edges, negative off axis curves have to be considered also.
- Set Feed to “on”, feed polar responses to current driver of speaker
- Set Step to “15”, off axis step on the horizontal and vertical orbits
Export to a text file. All the on and off axis horizontal and vertical SPL responses in positive and negative 15 degrees steps are saved. The off axis degree is automatically mentioned in the file names.
All the on and the off axis responses can be imported in the Vituix main program and be displayed in different charts.
Power and DI chart

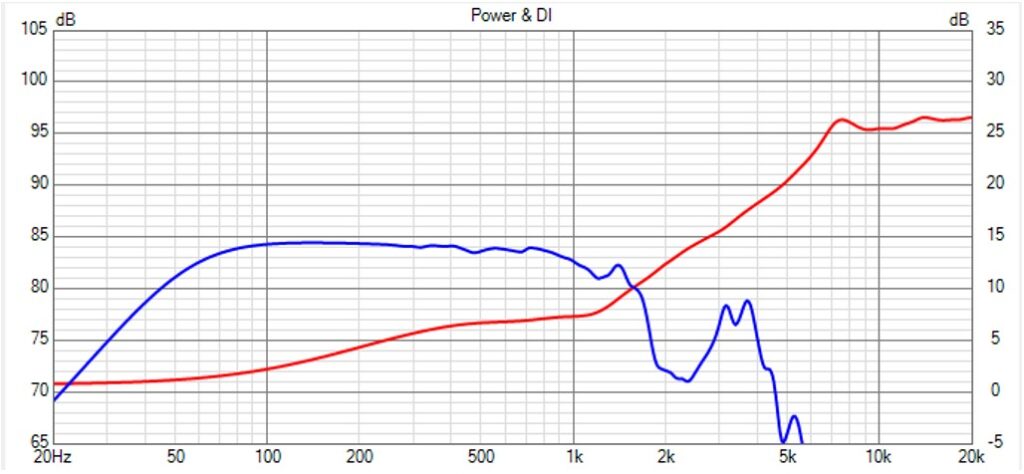
The power response is shown in blue. This curve will decrease at higher frequencies as a result of the directivity increase at higher frequencies.
The directivity index is shown in red. The ratio indicates the on axis power spectrum versus the total space power spectrum. At high frequencies the DI increases as the power becomes more and more focused on axis.
Directivity chart
Line chart

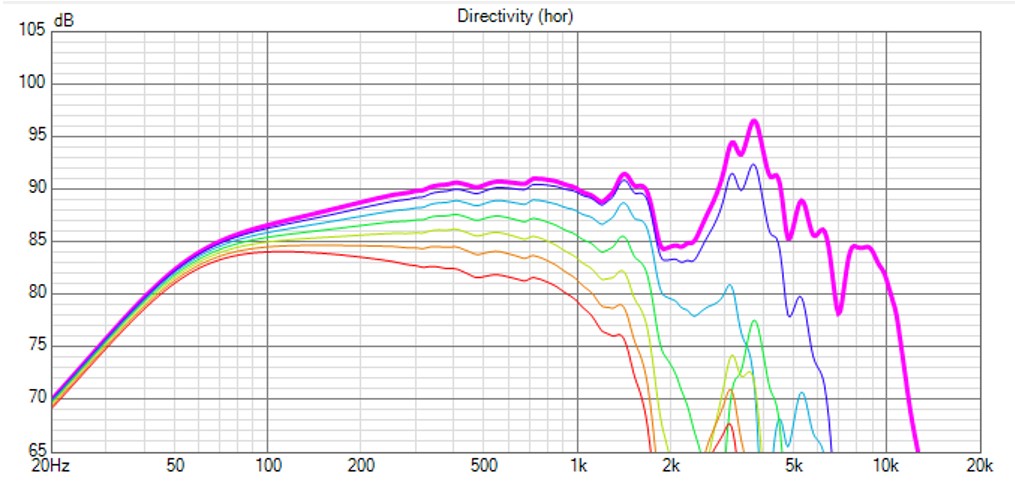
These are the horizontal on and off axis SPL curves, from 0 to 180 degrees for the Scanspeak 26W8534G00 in an enclosure in full space.
Polar chart

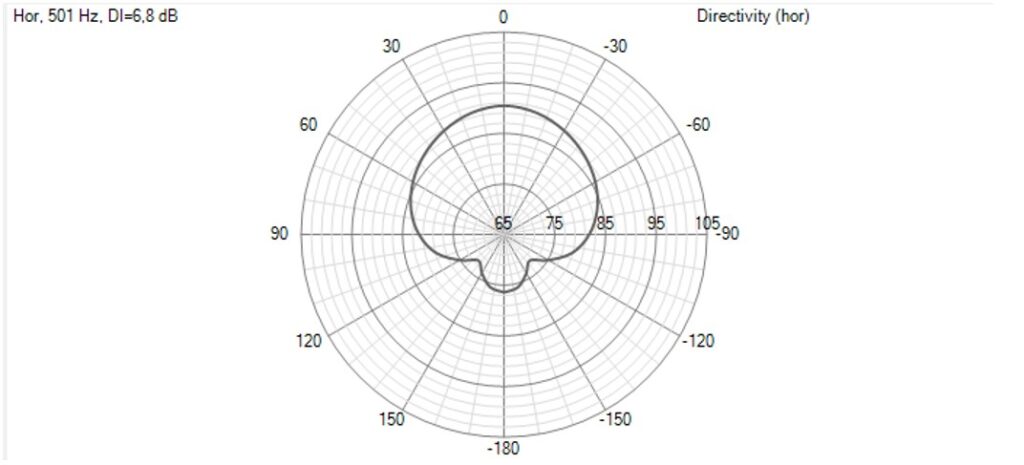
This is the polar response in the horizontal plane at 501 Hz.
The polar graph can be displayed at different frequencies in real time, using the slider below the Directivity chart. Using the normalized setting gives a good view how the polar diagram is changing as a function of frequency.
