Preparing a crossover design in a CAD tool
On this page is described how a crossover design can be prepared in VituixCAD.
Contents
Import SPL and impedance responses
Start (VituixCAD)
Save the project as a “vxp” project file.
Important for every project file!
Select (VituixCAD -> Options-> set the “Save chart overlay to project” to on.
Drivers TAB
Select (VituixCAD -> Drivers)
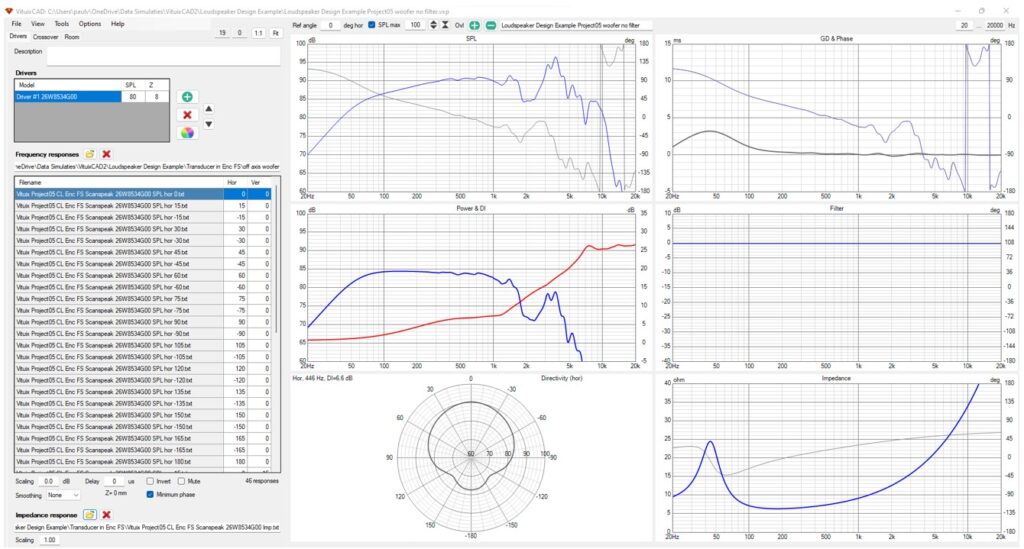
Open the SPL curves with “Frequency responses”.
Select all the horizontal and vertical files 0 to + 180 and to -180 degrees of simulations or measurements of the transducer in enclosure in full space. For this example we have chosen the Scanspeak 26W8534G00 in a 55 L closed box as used in the VCL EM2 loudspeaker.
Set Scaling to “0” dB
Set delay to “0” us
Set minimum phase to “on”
Set Smoothing to “none”
Open the impedance curve in enclosure with “Impedance response”.
Set Scaling to “1.0”
Crossover TAB
Select (VituixCAD -> Crossover)
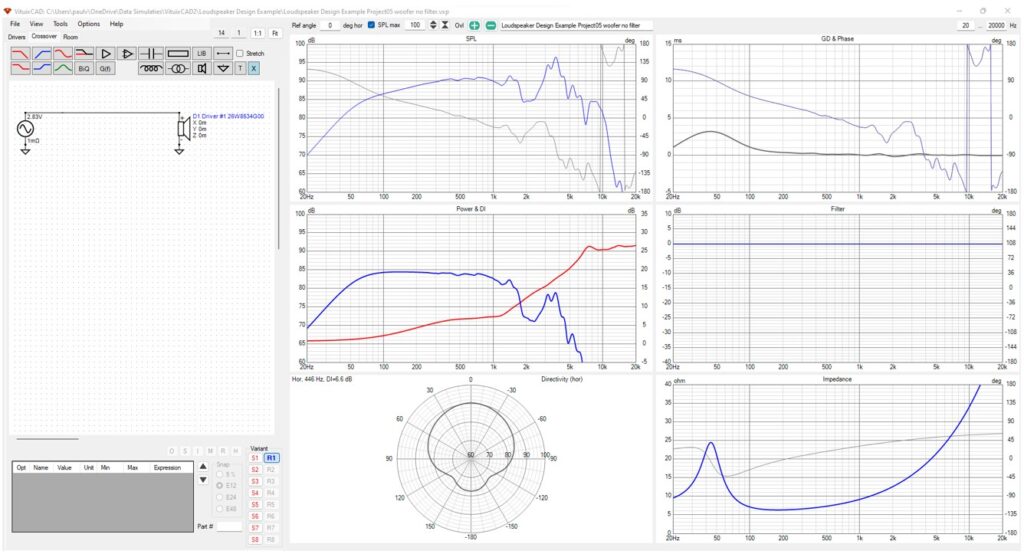
By default a 2.83 Vrms voltage source and a driver#1 are already visible in the crossover schematic.
Connect the source and the driver with a wire.
Now the responses of driver#1 are displayed in 6 charts. All the chart settings can be chosen, placing the mouse cursor in the chart of interest and clicking on the right mouse button.
Exploring the charts
SPL chart
While cursor on SPL chart with mouse right click.
Only select “Show Normal Phase”
While cursor on SPL chart, select “traces” with mouse right click.
Only select:
- trace ”Normal Phase”
- trace “D1 Driver#1 magnitude is selected by default
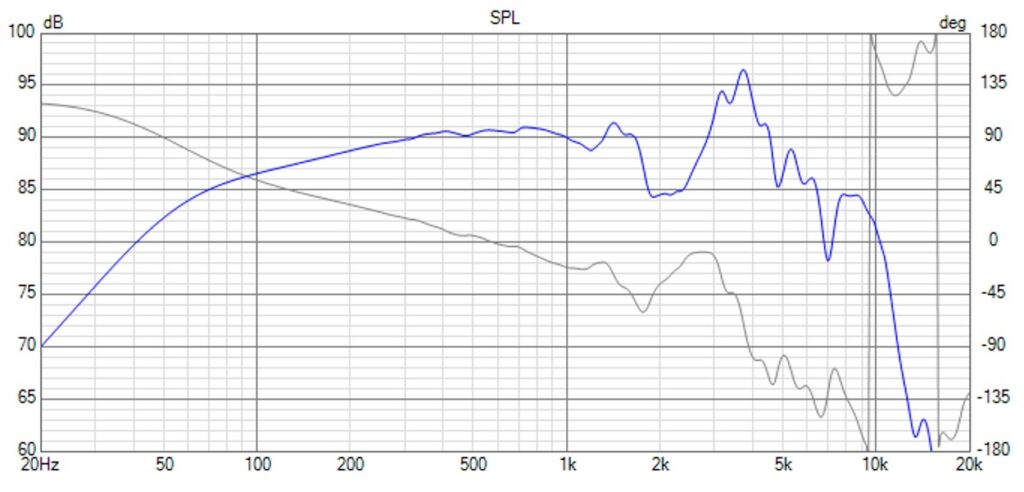
The SPL magnitude of the woofer in enclosure in full space is shown in blue color. No filter is applied yet. The phase response in grey color is shown as a minimum phase response.
Power & DI chart
While cursor on Power & DI chart, select “traces” with mouse right click.
- select trace ”Power response”
- select trace “Directivity Index”
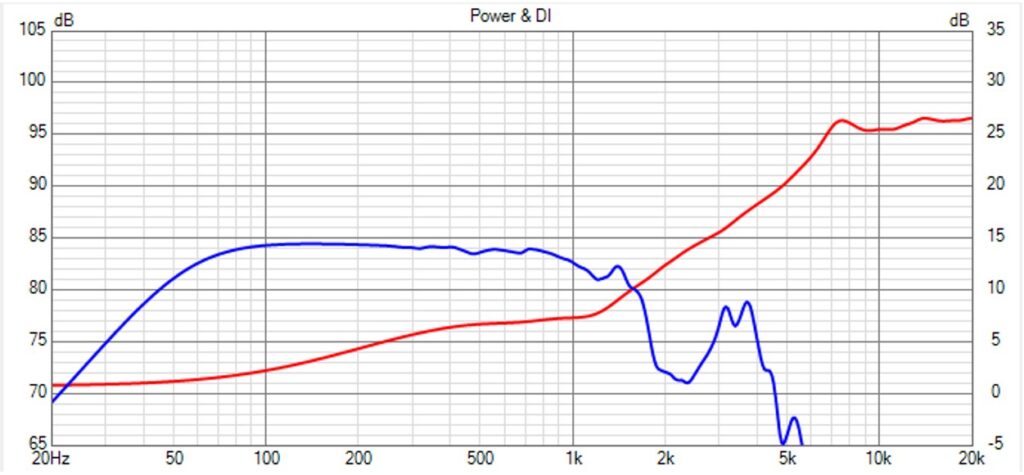
The power response is shown in blue and the directivity index is shown in red.
Directivity chart
While cursor on Directivity chart, different graphs can be selected to be displayed. Most interesting graphs are the “Line chart” and “Polar chart”.
All the graphs can be shown in horizontal and vertical plane or in more restricted domains, normalized to the on axis response or not.
Line chart
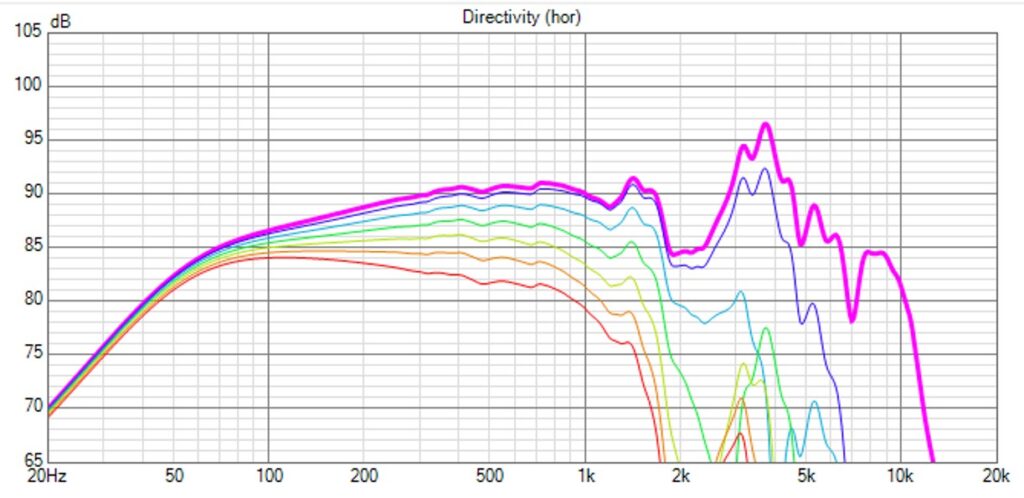
These are the horizontal on and off axis SPL curves, from 0 to 180 degrees.
Polar chart
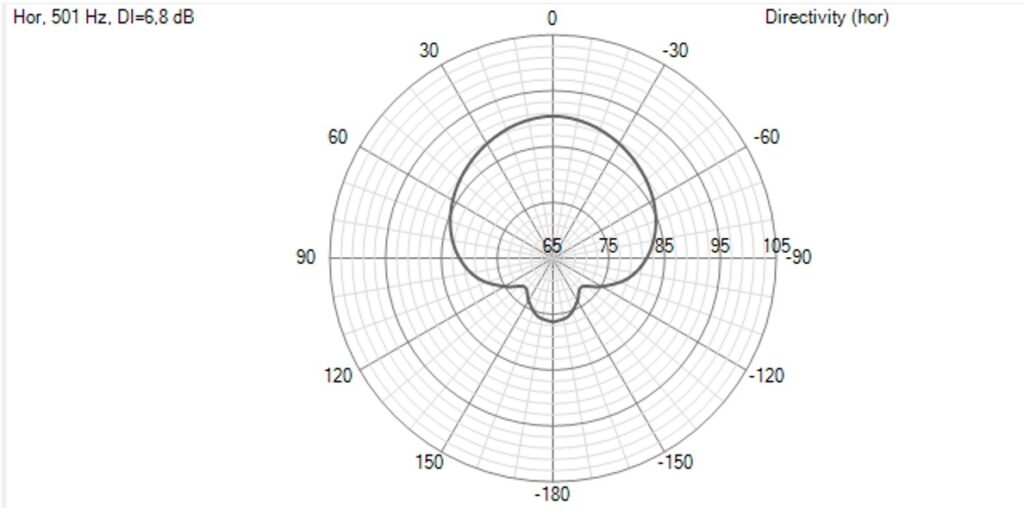
This is the polar response in the horizontal plane at 501 Hz.
The polar graph changes at different frequencies can be made visible in real time, using the slider below the Directivity chart. Using the normalized setting gives a good view hiw the polar diagram is changing as a function of frequency.
GD & Phase chart
While cursor on GD & Phase chart, different graphs can be selected to be displayed ” with mouse right click..
- Set “Show normal group delay” to “on”
- Set “Show normal group phase ” to “on”
While cursor on GD & Phase chart, select “traces” ” with mouse right click.
- Select trace “Normal group delay”
- Select trace “Normal phase”
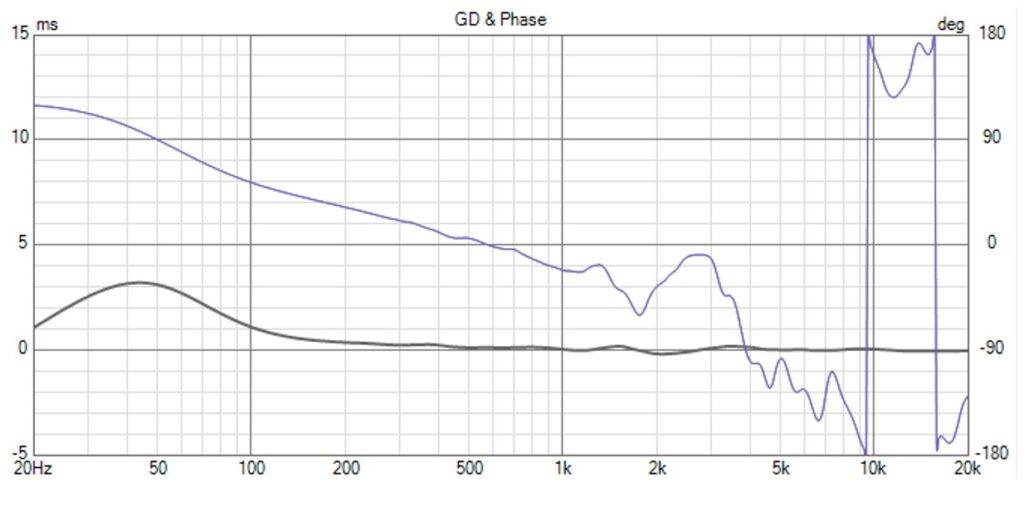
The phase is displayed in blue color, the group delay in grey color.
The group delay increases at low frequencies and can be used to do low frequency response analysis. If the group delay becomes more flat in a frequency range of interest, means the phase response is more linear.
Filter chart
In this chart the transfer function of the crossover filter is displayed.
While cursor on Filter chart, select “traces” with mouse right click. Select the wanted amplitude or phase graphs.
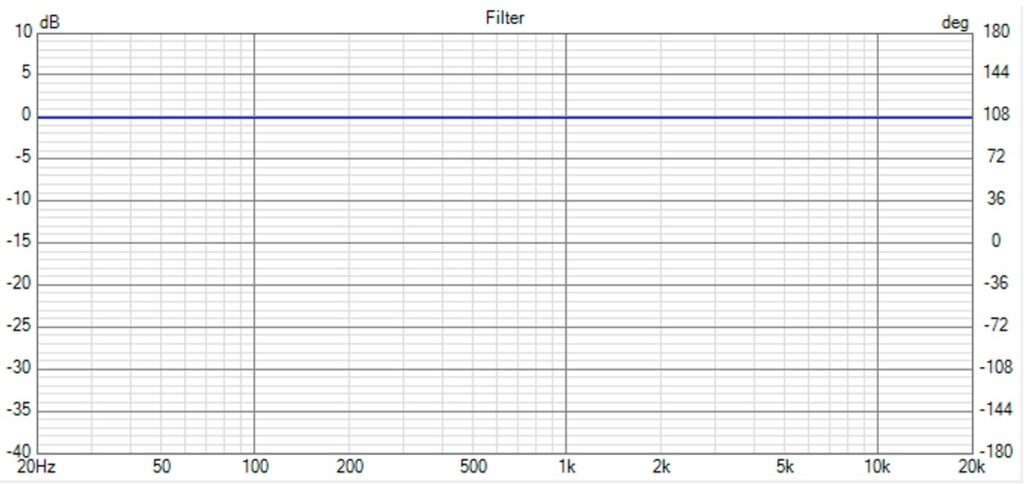
In this example the source and driver are connected to each other without a filter between them. So the filter response is a straight line of 0 dB.
Once the crossover filter will be designed, this chart is interesting to observe the crossover filter transfers of amplitude and/or phase of each driver of the loudspeaker.
Impedance chart
In this chart the impedance is displayed.
While cursor on Filter chart, select “traces” with mouse right click. Select the wanted graphs.
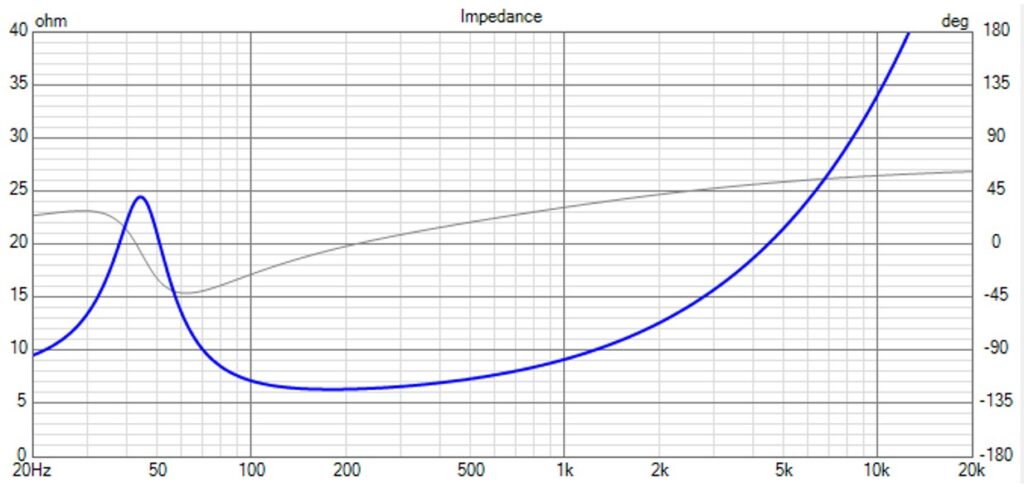
In this example the impedance of driver#1 is shown.
Response curves in one chart
It is interesting to display the responses of all the transducers used for the loudspeaker together in one chart. It allows to do some analysis to define the crossover filter parameters.
For each transducer a driver model is created in the CAD tool. For each driver the SPL and impedance responses in enclosure in full space, that are created with the CAD tools or measured with acoustical and electrical equipment, are imported.
Start (VituixCAD)
Important! Select (VituixCAD -> Options-> set the “Save chart overlay to project” to on
Important! To make an analog crossover design:
select (VituixCAD -> Options-> Frequency Responses) and set the DSP system to “Analog”
Drivers TAB
Select (VituixCAD -> Drivers)
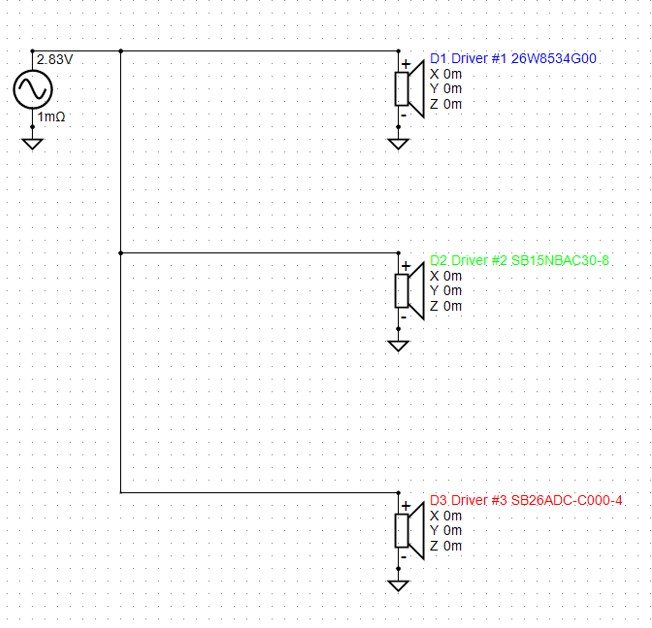
For a 3-way loudspeaker, create 3 drivers for woofer, midrange and tweeter.
Driver names can be chosen. For loudspeaker VCL EM2 the names are
- Driver #1 26W8534G00
- Driver #2 SB15NBAC30-8
- Driver #3 SB26ADC-C000-4
Connect the 3 drivers directly to the source like drawn in the schematic below.
In the VituixCAD main program, it is possible to select a response curve in a graph chart by placing the cursor on the response curve. Selecting the curve and while clicking the right mouse button, it can be saved as an overlay with “Save selected curve as overlay”.
In this way the SPL curves of the three loudspeaker transducers can be visualized in one chart.
SPL response of woofer (blue), midrange (green) and tweeter (red)
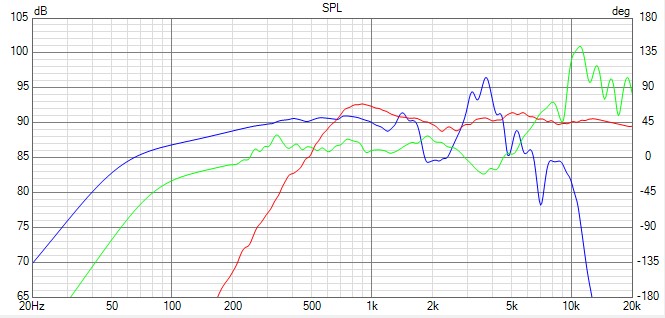
In this chart there can be observed that a loudspeaker with a sensitivity of about 83 dB and a frequency F3 = 40 Hz ( – 3 dB point) can be realized.
Power response of woofer (blue), midrange (green) and tweeter (red)
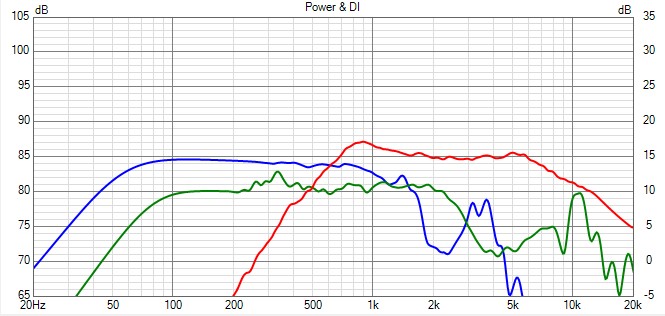
DI of woofer (blue), midrange (green) and tweeter (red)
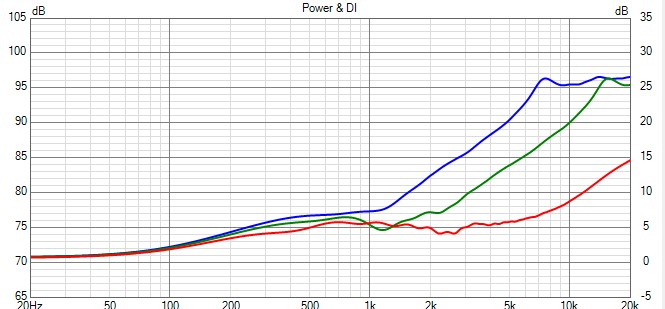
This DI chart is interesting to define the crossover frequencies. It can be observed that for crossover frequencies 250 Hz and 2500 Hz, the total DI can be kept constant at a value around 6 dB from 250 to 5000 Hz.
This DI chart is one of the criteria to choose the crossover frequencies.
