Active filter with generic filter blocks
In this page the design of an analog active filter with generic filter blocks is explained.
For an active DSP filter the generic filter blocks will be transformed to digital biquads.
For an active ASP filter the generic filter blocks will be transformed to analog opamp filter blocks.
The three way LR4 250 – 2500 Hz crossover filter of loudspeaker example VCL EM2 is chosen.
VituixCAD is used for the filter design.
Contents
- Generic filter blocks
- Acoustic centers of the drivers
- Import crossover filter targets in the CAD tool
- Crossover filter design using the CAD tool
Generic filter blocks
The active analog filter with generic filter blocks for each driver will be realized between the source and the driver. The driver response inclusive the crossover filter has to fit on the filter target.
Different generic filter blocks are available in a CAD tool to realize a filter for each driver.
Most frequently used filter blocks are:
- Low pass filter with different order, frequency and Q – factor
- High pass filter with different order, frequency and Q – factor
- All pass filter first and second order
- Bandpass filter first order with selectable frequency, gain and Q-factor
- Parametric Equalizers with selectable frequency, boost/cut gain and Q – factor
- Low pass equalization filter, lo – shelf, boost and cut
- High pass equalization filter, hi – shelf, boost and cut
- First order bandreject filter, with adjustable pole and zero frequency, and Q – factor
Acoustic centers of the drivers
The settings of the acoustic centers of the transducers in the CAD tool, depends on the crossover filter type DSP, ASP or passive filter. For most CAD tools the acoustic center of the tool can be set by the driver z- coordinate.
DSP
For a DSP filter a minimum phase crossover design is made. It means that all acoustic centers are set to zero (z-coordinate drivers = 0). In a DSP filter a time delay for each driver filter can be chosen, to compensate for the acoustic center different positions of the drivers.
ASP and passive filter
For an ASP and passive filter a non- minimum phase crossover design is made. It means that all acoustic centers of the driver are set to their position by choosing the z-coordinate for each driver.
Acoustic center differences between drivers cause some positive or negative phase delays. To realize phase – aligning, all pass filtering can be added to the filter or filter slopes can be chosen a little different from target to compensate for positive or negative delay.
For this page, a minimum phase crossover filter will be designed as a first example.
Import crossover filter targets in the CAD tool
Start (VituixCAD).
Create a project like described in Tech Page 19 – VCLLabs, the three drivers with all responses imported and all drivers connected to the source.
Important! Select (VituixCAD -> Options-> set the “Save chart overlay to project” to on
Important! To make an analog crossover design:
select (VituixCAD -> Options-> Frequency Responses) and set the DSP system to “Analog”
Keep the 3 drivers all connected directly to the source like drawn in the schematic below.
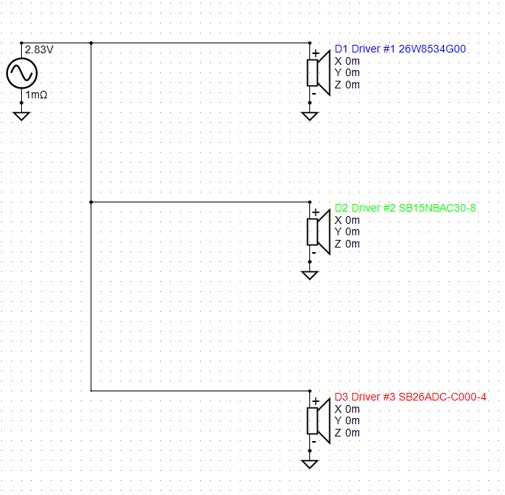
Import filter targets
While cursor on SPL chart and with mouse right click, select “Open overlay…” and select the woofer SPL target text file like created in Tech Page 12 – VCLLabs.
In the same way also select the midrange and the tweeter SPL target text files.
While cursor on SPL chart, select “traces” with mouse right click.
Only select the overlay and driver traces.
Following SPL chart is displayed.
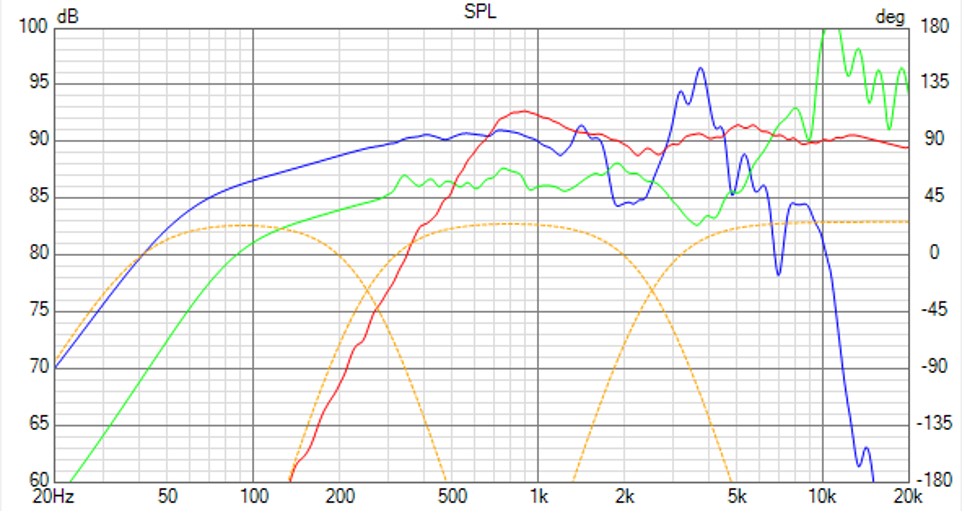
The 3 driver SPL responses, woofer in blue, midrange in green and tweeter in red, are displayed together with the 3 targets curves in yellow.
The crossover filter has to designed in a way that the 3 drivers, with the filter added between the source and each driver, will fit on the targets.
Crossover filter design using the CAD tool
Generic functional blocks are added between the source and the three drivers like mentioned in the schematic below.
Different generic filter blocks can be chosen in the menu.

Selecting a block in the schematics, allows to set the block parameters like frequency, gain, Q-factor,… in a pop – up window.
There is no real rule how to choose the kind of blocks. While adding the blocks the filtered drivers have to be monitored in the SPL and phase chart, to fit in the best way on the LR4 target curves. One gets more and more experience by making more designs and study existing crossover designs.
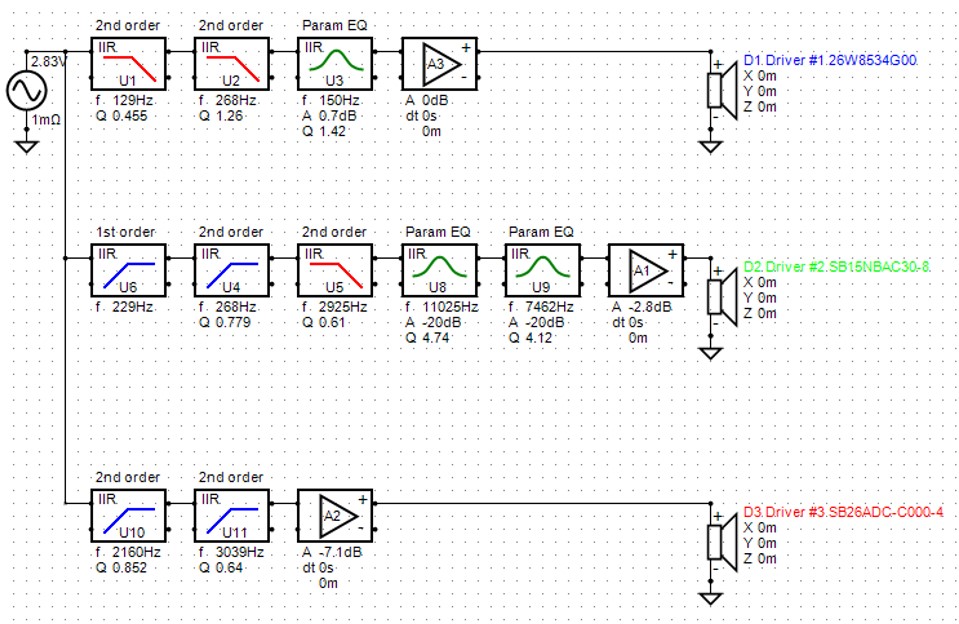
SPL chart
In the SPL chart, there can be observed how the filtered SPL driver curves fit on the targets using this filter design.
While cursor on SPL chart, select “traces” with mouse right click.
- Set trace ”Reference angle” on
- Set all the target traces to on
- The three driver magnitude traces are selected by default
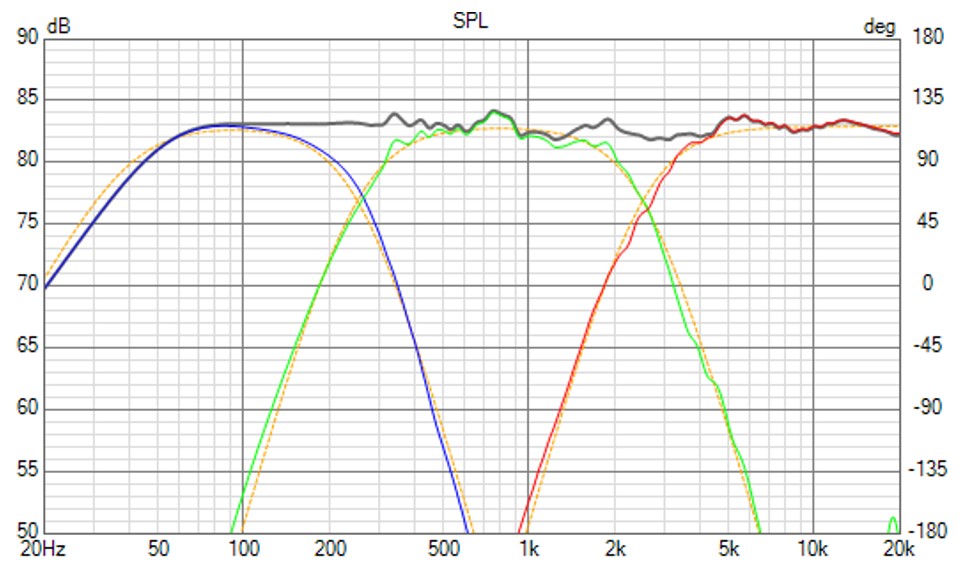
The SPL magnitude of the woofer with filter in blue color, the midrange with filter in green color and the tweeter with filter in red color. The sum curve in black color. All the filter targets in yellow.
Power & DI chart
While cursor on Power & DI chart and with mouse right click, select “traces”
- select trace ”Power response”
- select trace “Directivity Index”
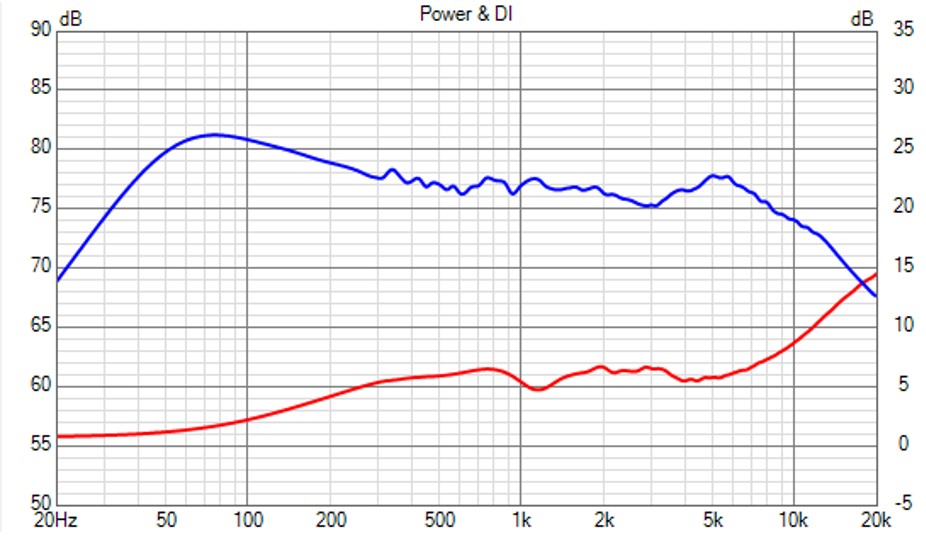
The power response is shown in blue.
The power curve will increase at low frequencies as the radiation domain for this type of loudspeaker radiation type changes from infinite baffle at high frequencies to full space at low frequencies. The transition is located around 300 Hz. It is important that the power has a smooth constant response above the transition frequency. The power response will decrease above 5 kHz as the tweeter becomes more and more directional above this frequency.
The directivity index is shown in red.
The ratio indicates the on axis power spectrum versus the total space power spectrum. Using three drivers with different moving surfaces, the DI curve can be kept flat up to 5 kHz. For this loudspeaker example project, a 10 inch woofer, a 5 inch midrange and a 1 inch tweeter are chosen to realize this flat directivity index response. At low frequencies the DI decreases to zero as the radiation becomes more and more omnidirectional below 300 Hz.
Directivity chart
While cursor on Directivity chart, different graphs can be selected to be displayed. Most interesting graphs are the “Line chart” and “Polar chart”.
All the graphs can be shown in horizontal and vertical plane or in more restricted domains, normalized to the on axis response or not.
Line chart
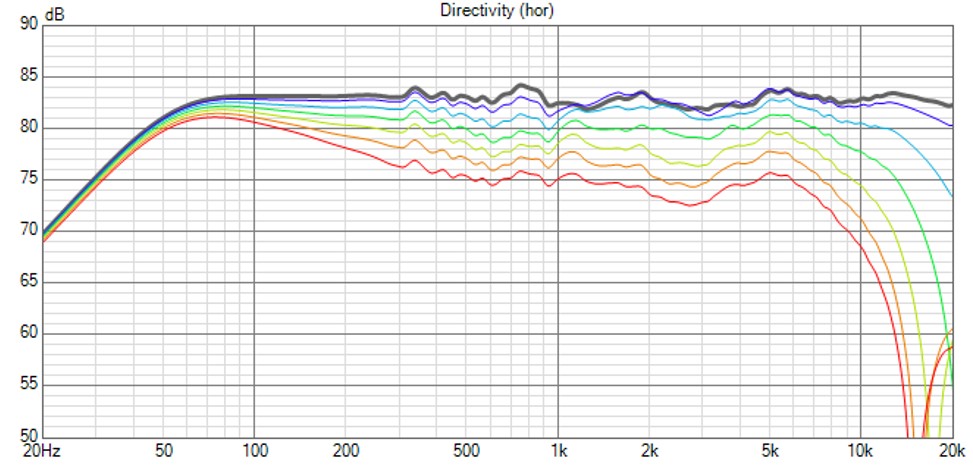
These are the horizontal on and off axis SPL curves, from 0 to 90 degrees.
Polar chart
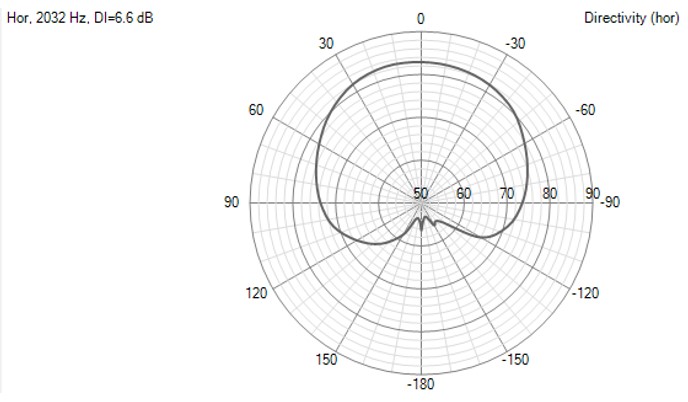
This is the polar response in the horizontal plane at 2000 Hz.
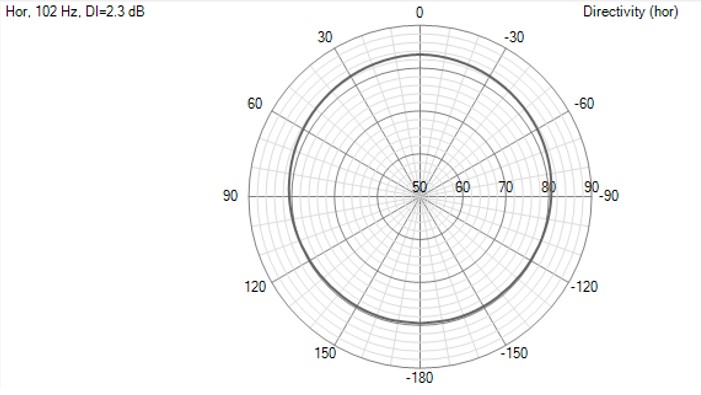
This is the polar response in the horizontal plane at 100 Hz.
It can be observed the polar graph is more omnidirectional at 100 Hz than at 2000 Hz where the radiation becomes more and more directional forwards with an infinite baffle domain behavior.
GD & Phase chart
While cursor on GD & Phase chart, with mouse right click, different graphs can be selected to be displayed ” Set “Show normal group delay” to “on”.
- Set “Show normal group phase ” to “on”
While cursor on GD & Phase chart, with mouse right click, select “traces”.
- Select trace “Normal group delay”
- Select trace “Normal phase”
- The phase traces of the three drivers are selected by default
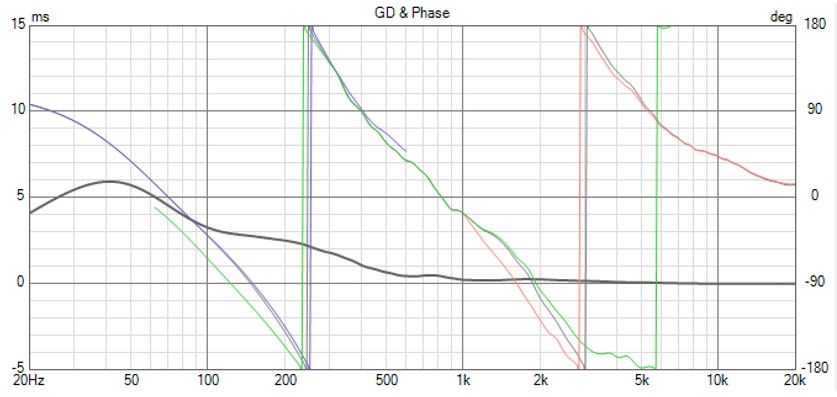
The woofer filter phase is displayed in blue color, phase midrange in green and phase tweeter in red, the group delay in grey color.
The phases are well aligned. The group delay increase at low frequencies is caused by the high pass filter behavior at frequency F3 = 40 Hz for this loudspeaker.
Filter chart
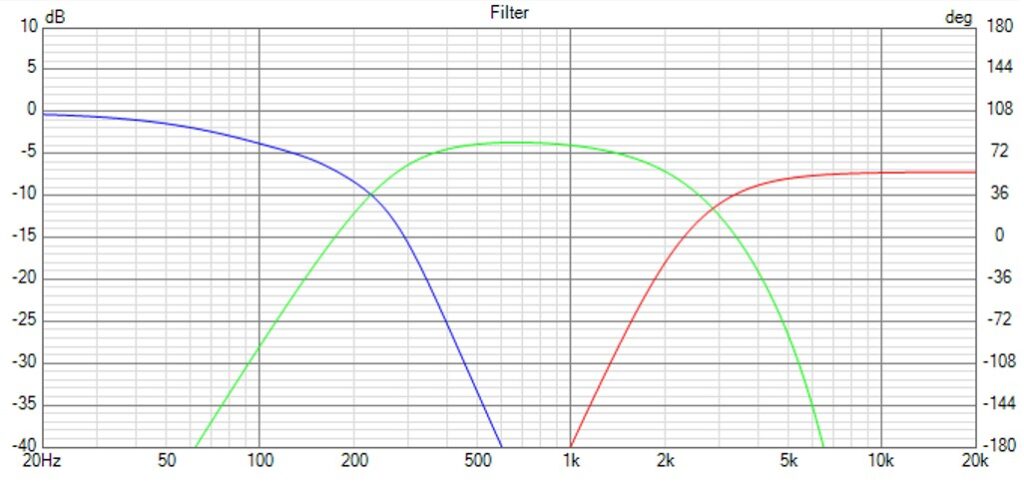
In this chart the transfer function of the crossover filter for each driver is displayed.
While cursor on Filter chart, select “traces” with mouse right click.
The filter transfer of the three drivers are selected by default.
Impedance chart
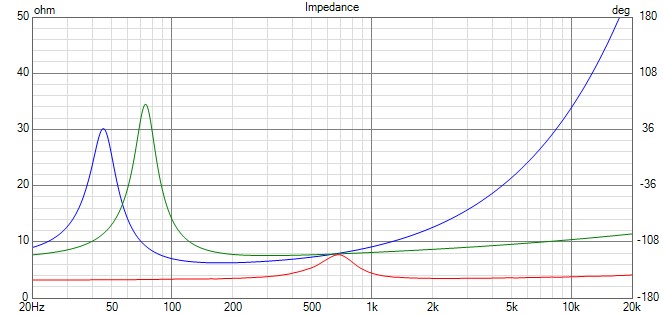
In this chart the impedance is displayed.
While cursor on Filter chart, select “traces” with mouse right click. Select the wanted graphs.
Woofer impedance in blue, midrange impedance in green and tweeter impedance in red.
For an active filter, the “Load impedance on the source” is not relevant.
Using a passive filter design, this load impedance is important to be monitored.
