June 2023 – VCL EM2, 3-way loudspeaker – Scanspeak woofer and SB Acoustics midrange and tweeter – DSP, ASP and passive filtering – Design using VituixCAD

The VCL EM2 is a loudspeaker that has been designed using VituixCAD and built by VCLLabs. Acoustical and electrical measurements have been done. It makes this loudspeaker interesting as an example for loudspeaker design.
For the woofer the Scanspeak 26W8534G00 is chosen, for the midrange the SB15NBAC30-8 and for the tweeter the SB26ADC-C000-4. These are all drivers with low distortion and not expensive drivers.
For the crossover filter a DSP filter has been designed first. With a miniDSP Flex Eight setup the first design evaluation has been done. Started with a Linkwitz-Riley 4th order filter and optimized that one first. Once the crossover schematic with generic filter blocks is defined, it can be transformed to biquad filters for DSP programming or to analog opamp filter blocks to make an active analog ASP version of it.
A passive filter version is designed also.
Different filter types like Linkwitz-Riley 4th and 2nd order, Butterworth 3rd order, Elliptical 3rd and 5th order were tested with this speaker.
Some numbers of this speaker. The cabinet is 105 cm high (incl. foot), 40 cm wide and 29 cm deep. Sensitivity is 83 dB at 1m, 2.83 Vrms, full space, F3 = 40 Hz and maximum SPL is 97 dB @ 1m, full space.
Contents
- Specification Headlines
- Estimation Bill Of Material
- Transducers
- Cabinet
- Enclosure design
- Crossover design
- Acoustical and electrical measurements
Specificaton Headlines
- System: 3-way, woofer and midrange closed box system, DSP, ASP, passive X-over
- Woofer: Scanspeak 26W8534G00
- Midrange: SB Acoustics SB15NBAC30-8
- Tweeter: SB Acoustics SB26ADC-C000-4
- Low frequency response: F3 = 40 Hz, F6 = 31 Hz and F12 = 22 Hz
- Sensitivity: 83 dB at 1m, 2.83 Vrms, full space
- SPL at maximum excursion, 40 – 20000 Hz: 97 dB, 1m, full space
- Crossover: LR4 250 and 2500 Hz
- Cabinet dimensions incl. foot: width x heigth x depth = 40 cm x 105 cm x 29 cm
Estimation Bill Of Material exclusive crossover filter
- 2 x Woofer Scanspeak 26W8534G00: 340 euro
- 2 x Midrange SB Acoustics SB18NBAC30-8: 154 euro
- 2 x Tweeter SB Acoustics SB26ADC-C000-4: 110 euro
- Cabinet material: 100 euro
- Cabinet Accessoires: 100 euro
- Total: 804 euro
Transducers
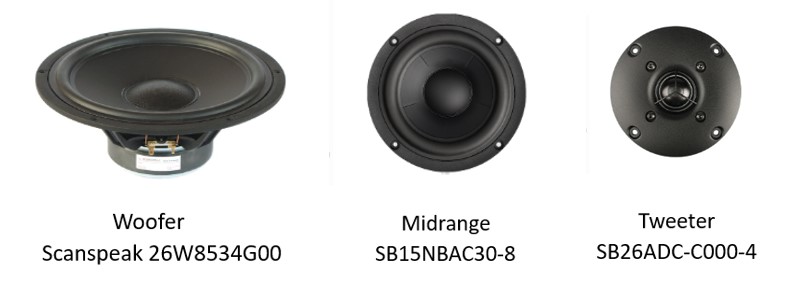
Scanspeak 26W8534G00, SB Acoustics SB15NBAC30-8, SB Acoustics SB26ADC-C000-4
These three transducers are chosen for their good price – quality performance. They all have a very smooth SPL response in their operating frequency range.
The 10 inch aluminium cone Scanspeak 26W8534G00 is used as woofer. The driver sensitivity is 89 dB @ 2.83 Vrms, 1m and the maximum lineair excursion is 6 mm peak. An overall loudspeaker sensitivity of 83 dB can be realized for F3 = 40 Hz. The 4 Ohm version of this driver is measured by HifiCompass. The harmonic distortion is low, better than -45 dB between 50 and 800 Hz and better than -55 dB between 100 and 250 Hz at 2.83 Vrms.
As midrange the 5 inch aluminium cone SB Acoustics SB15NBAC30-8 is chosen. The driver sensitivity is 85.5 dB @ 2.83 Vrms, 1m and the maximum lineair excursion is 5 mm peak. The 4 Ohm version of this driver is measured by HifiCompass.The harmonic distortion of this transducer is very low, better than -60 dB between 200 and 4000 Hz at 2.83 Vrms.
The SB Acoustics SB26ADC-C000-4 is a 1 inch aluminium dome tweeter. The driver sensitivity is 90 dB @ 2.83 Vrms, 1m and the maximum lineair excursion is 0.6 mm peak. This driver is measured by HifiCompass.The harmonic distortion of this transducer is low, better than -50 dB between 1.5 and 15 kHz and better than -55 dB between 2.5 and 12 kHz at 2.83 Vrms.
Cabinet
Cabinet dimensions
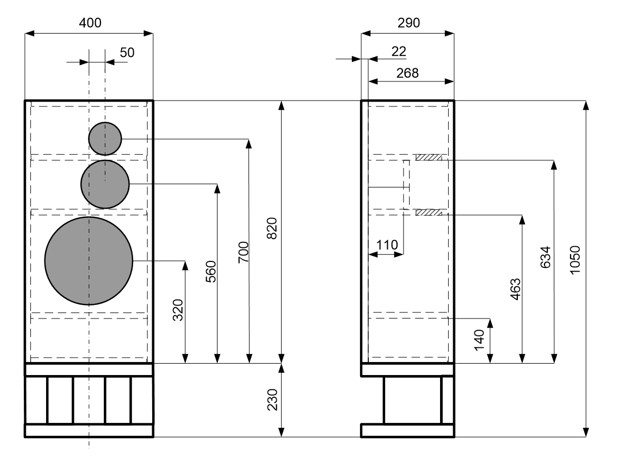
All the walls are 18 mm, the front panel is 22 mm.
Enclosure Design
The enclosure design for this VCL EM2 is done like described in the technical pages. The SPL and impedance responses of all tranducers placed in enclosure in full space are created using the transducer datasheets. These responses will be needed for the crossover filter design.
Also acoustical and electrical measurements of the responses in full space will be done, to compare with the simulated results. The crossover design will be adapted using these measurements.
The Enclosure Design is done with VitixCAD.
Contents Enclosure Design
- Transducers on infinite baffle
- Transducers in enclosure on infinite baffle
- Transducer in enclosure in full space
- SPL off axis – Power and Directivity Index – full space
Transducers on infinite baffle
This design part is done like described in Tech Page 08 – VCLLabs.
SPLTrace datasheet responses
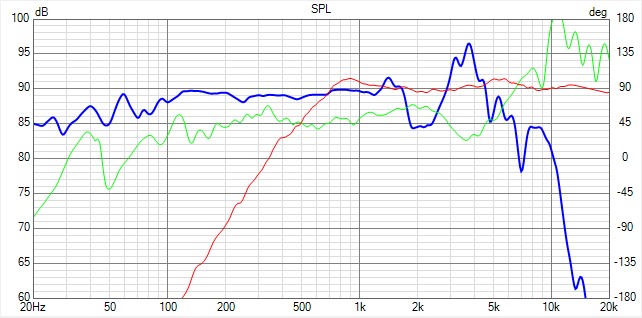
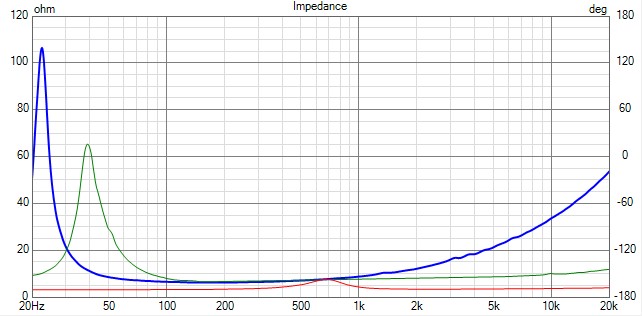
All the SPL and impedance responses of transducer datasheets are traced with the Vituix SPLTrace tool and saved as text files in the VCL EM2 Project directory. In this way the curves can be used in the further enclosure design. The curves can be imported in the Vituix main program to be displayed, like in the charts below.
SPLTrace datasheet SPL all tranducers
SPLTrace datasheet impedance all tranducers
The VituixCAD project file is saved as “VCL EM2 SPLTrace datasheet responses all tranducers.vxp”
Make TSP model
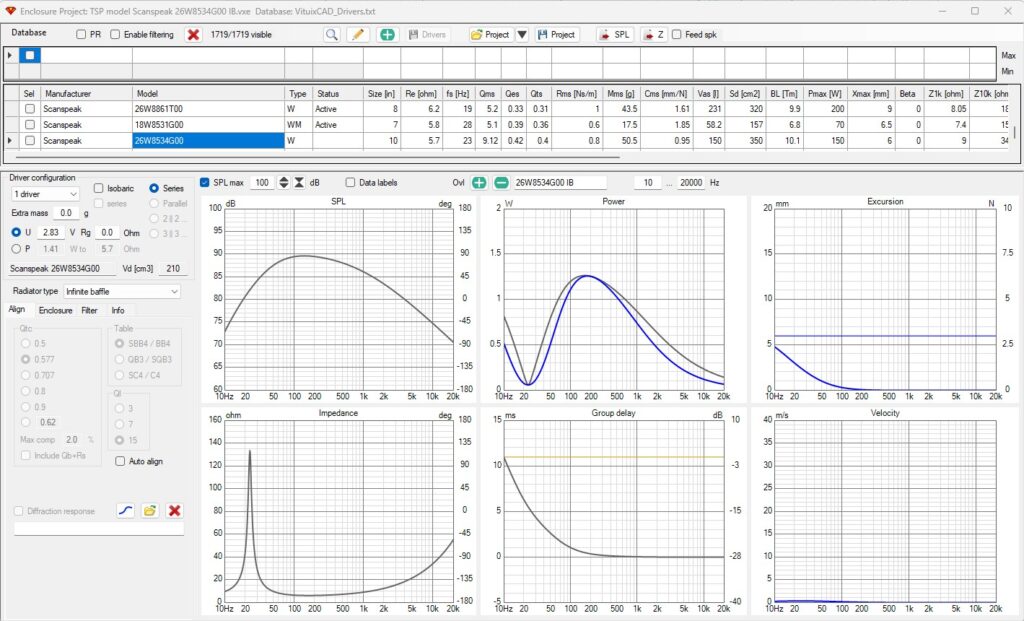
For the woofer and the midrange, TSP models are made as their low frequency responses of the datasheet are not correct.
For the tweeter, no TSP model is made as the low frequency repsonse of the datasheet is correct enough.
TSP model woofer Scanspeak 26W8534G00
TSP
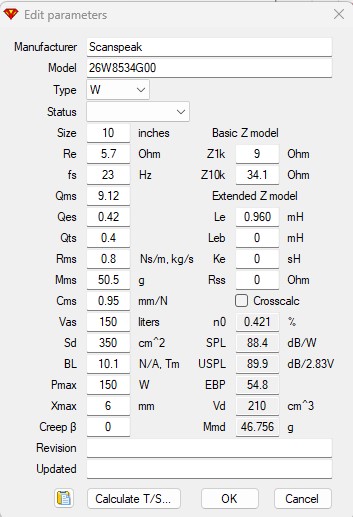
Charts in Vituix Enclosure tool
TSP model midrange SB15NBAC30-4
TSP
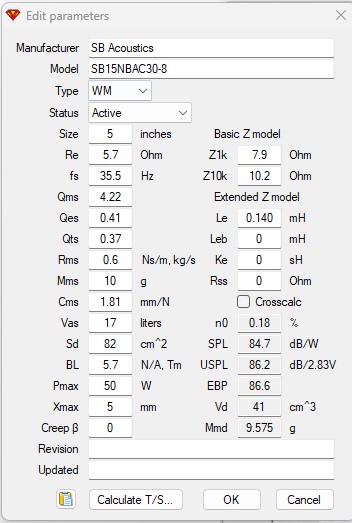
Charts in Vituix Enclosure tool
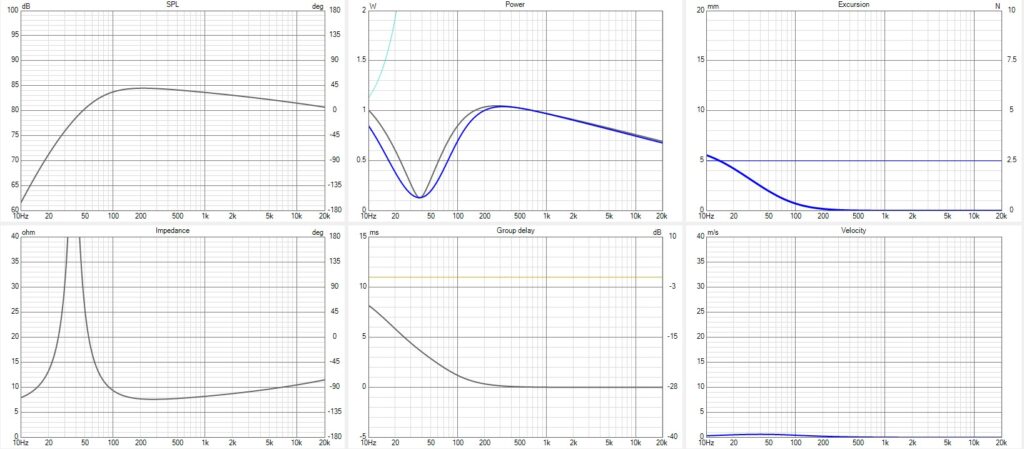
The SPL is saved as a text file “Vituix TSP model SB15NBAC30-8 IB SPL.txt”.
The impedance is saved as a text file “Vituix TSP model SB15NBAC30-8 IB Imp.txt”.
The Enclosure project is saved as a “vxe” file “TSP model SB15NBAC30-8 IB.vxe”
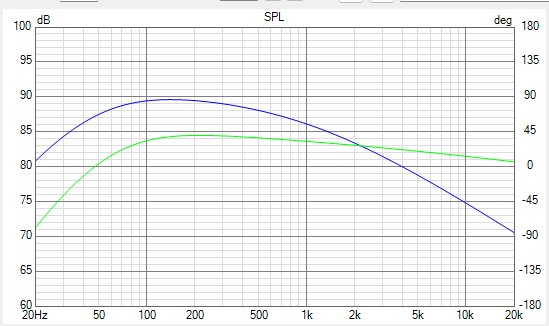
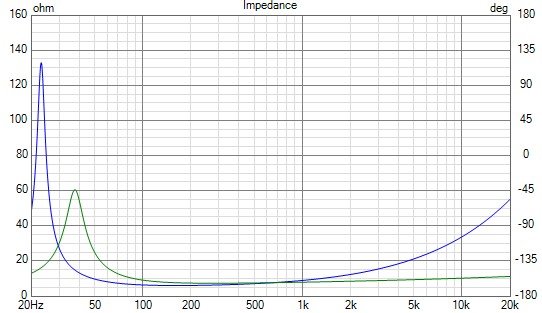
The curves can be imported in the Vituix main program to be displayed, like in the charts below.
TSP model on IB for woofer and midrange SPL
TSP model on IB for woofer and midrange Impedance
The VituixCAD project file is saved as “VCL EM2 TSP model IB woofer and midrange.vxp”
Merging SPL of TSP model and SPL curve of datasheet
For the woofer and the midrange, merging of the SPL of the TSP model and the SPL of the datasheet are made. In this way the responses of the woofer and the midrange on infinite baffle are created with correct SPL values at low frequencies.
For the tweeter, no TSP model is made. The SPL of the tweeter on infinite baffle will be chosen equal to the SPL of the datasheet.
For the merging the Vituix Merger tool is used, like described in Tech Page 08 – VCLLabs.
The SPL curves of woofer and midrange, realized with the merger tool, are saved as text files:
“Vituix Scanspeak 26W8534G00 IB SPL.txt”
“Vituix SB Acoustics SB15NBAC30-8 IB SPL.txt”
The curves of all tranducers on infinite baffle can be imported in the Vituix main program to be displayed, like in the charts below.
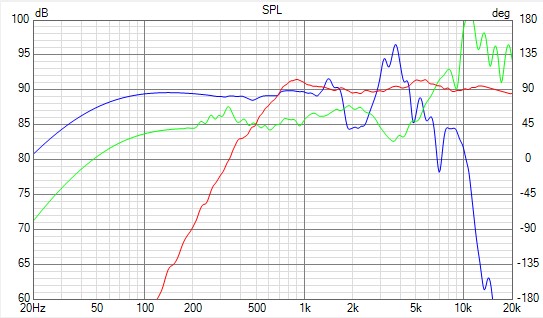
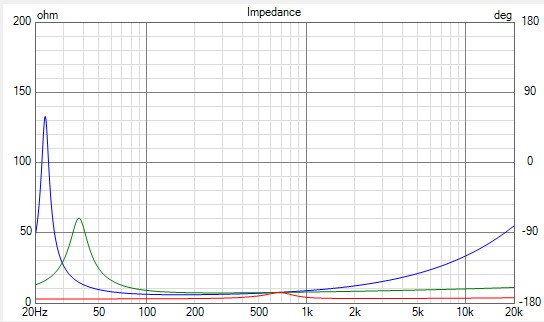
The VituixCAD project file is saved as “VCL EM2 All transducers on IB.vxp”
Back to top of “Enclosure Design”
Transducers in enclosure on infinite baffle
Placing woofer and midrange in an enclosure, the SPL and impedance responses will change, especially at low frequencies. It means the TSP model of the transducer will become different too. A TSP model of the woofer and the midrange placed in enclosure on infinite baffe must be made. The tweeter is closed at the backside, the enclosure has no impact. For the tweeter the responses on infinite baffle can be used.
This design part is done like described in This design part is done like described in Tech Page 09 – VCLLabs.
The Vituix Enclosure tool is used for this part of the design.
Transducer TSP model in enclosure – closed box radiator type
TSP model woofer Scanspeak 26W8534G00 in enclosure
For this loudspeaker VCL EM2, the woofer is placed in a 55 L closed box filled with dampening material.
In the Enclosure window:
- Select radiator type: “closed”
- While cursor on SPL chart, select “show effect of inductance” with mouse right click.
- Choose: extra mass = 0.0 g; U = 2.83 Vrms; Rg = 0 Ohm
- Choose Enclosure TAB (not the Align TAB) and set volume to 55 L, Qa = 20 and Ql = 3.6.
Under the Info TAB, a complete read out of the closed box system parameters is displayed.
Charts in Vituix Enclosure tool
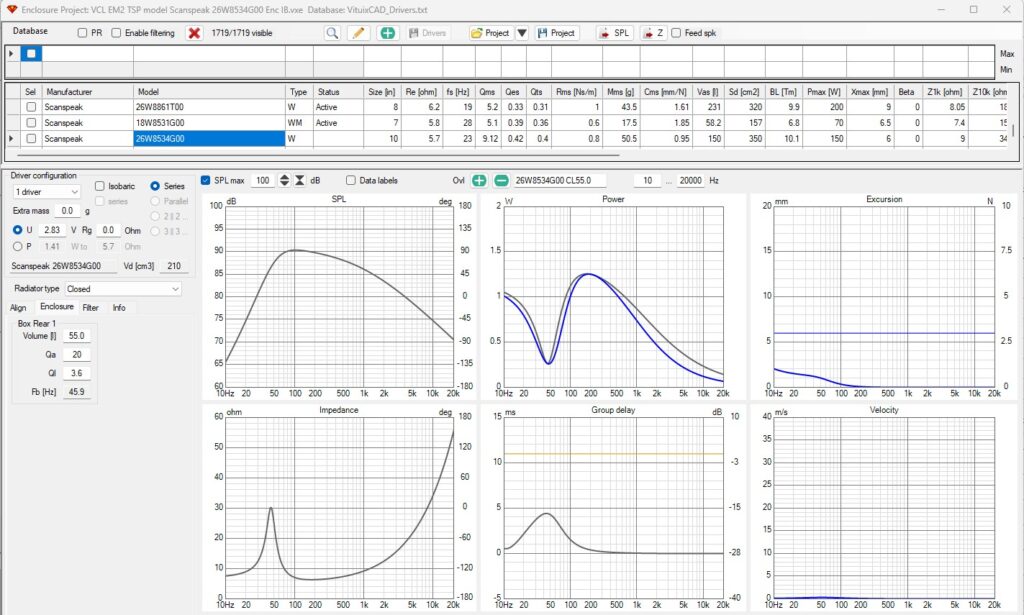
The SPL is saved as a text file “Vituix VCL EM2 TSP model Scanspeak 26W8534G00 Enc IB SPL.txt”.
The impedance is saved as a text file “Vituix VCL EM2 TSP model Scanspeak 26W8534G00 Enc IB Imp.txt”.
The Enclosure project is saved as a “vxe” file “VCL EM2 TSP model Scanspeak 26W8534G00 Enc IB.vxe”.
TSP model midrange SB15NBAC30-8 in enclosure
For this loudspeaker VCL EM2, the midrange is placed in a 6 L closed box filled with dampening material.
In the Enclosure window:
- Select radiator type: “closed”
- While cursor on SPL chart, select “show effect of inductance” with mouse right click.
- Choose: extra mass = 0.0 g; U = 2.83 Vrms; Rg = 0 Ohm
- Choose Enclosure TAB (not the Align TAB) and set volume to 6 L, Qa = 30 and Ql = 16.
Under the Info TAB, a complete read out of the closed box system parameters is displayed.
Charts in Vituix Enclosure tool
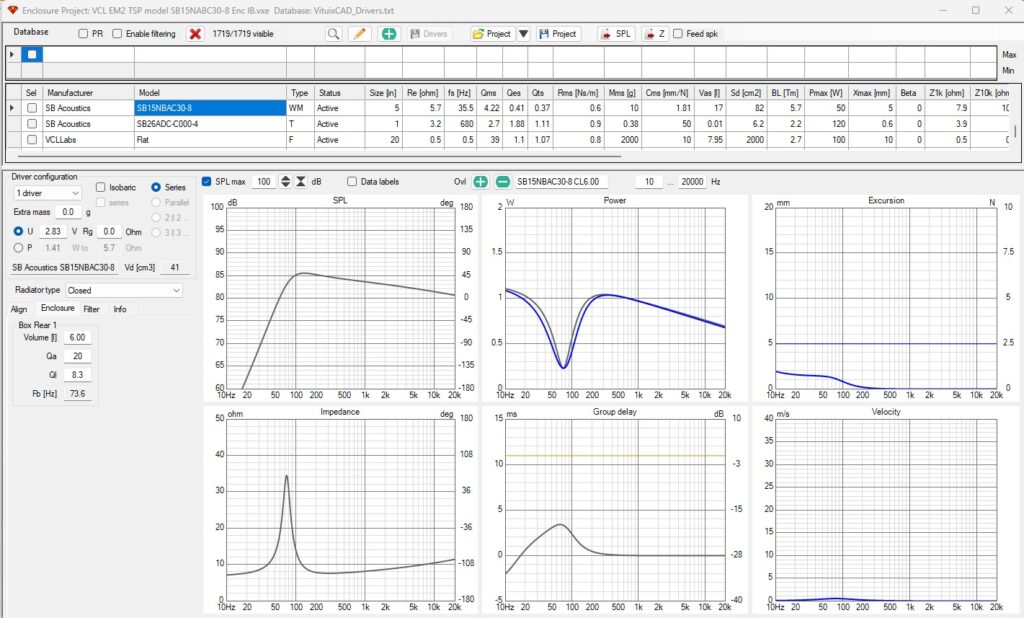
The SPL is saved as a text file “Vituix VCL EM2 TSP model SB15NBAC30-8 Enc IB SPL.txt”.
The impedance is saved as a text file “Vituix VCL EM2 TSP model SB15NBAC30-8 Enc IB Imp.txt”.
The Enclosure project is saved as a “vxe” file “VCL EM2 TSP model SB15NBAC30-8 Enc IB.vxe”.
Merging SPL of TSP model in enclosure and SPL curve of transducer on infinite baffle
For the woofer and the midrange, merging of the SPL of the TSP model in enclosure and the SPL of the transducer on infinte baffle are made.
For the tweeter, no TSP model is made. The SPL of the tweeter in enclosure on infinite baffle will be chosen equal to the SPL of the datasheet.
For the merging the Vituix Merger tool is used, like described in Tech Page 08 – VCLLabs.
The SPL curves of woofer and midrange, realized with the merger tool, are saved as text files:
“Vituix Scanspeak 26W8534G00 Enc IB SPL.txt”
“Vituix SB Acoustics SB15NBAC30-8 Enc IB SPL.txt”
The curves of all tranducers on infinite baffle can be imported in the Vituix main program to be displayed, like in the charts below.
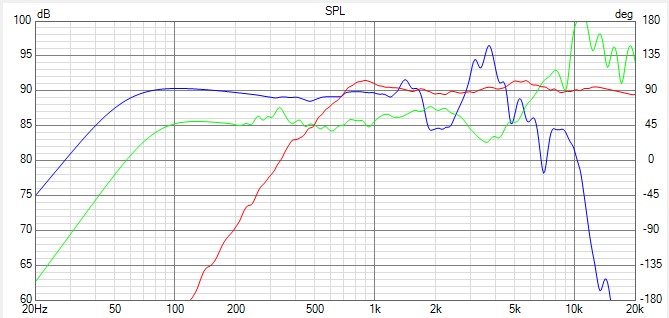
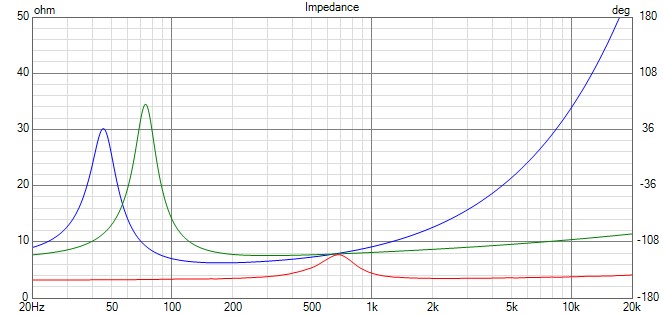
The VituixCAD project file is saved as “VCL EM2 All transducers Enc IB.vxp”
Back to top of “Enclosure Design”
Transducer in enclosure in full space
The full space response can be simulated with the CAD tool when the “SPL response in enclosure on infinite baffle” of the transducer is available.
This design part is done like described in Tech Page 10 – VCLLabs.
The Vituix Diffraction tool is used for this part of the design.
Start (VituixCAD->Tools->SPL Diffraction)
Woofer Scanspeak 26W8534G00
Baffle, driver model and position
for the baffle:
- set width to “400 mm”
- set height to “820 mm”
- set corners to “4”
- set ideal edge “on” and open baffle “off”
for the woofer transducer:
- set diameter to “211 mm”
- set count to “1”
for the axis:
- set Distance to “3000 mm” (mean listening distance)
- set Angle Hor and Angle Ver to “0” ( on axis response)
for reflection: set all off (full space)
Push the “New” button below on the window. The baffle and transducer appear in the left window. Position of the transducer and the microphone icon can be adapted by selecting them by the mouse and drag to the right position. The position can be read out in the View window.
For the loudspeaker example the coordinates of the woofer transducer are 200 mm horizontal and 320 mm vertical. The coordinates of the microphone are also 200 mm horizontal and 320 mm vertical.
SPL response of the transducer in enclosure in full space
Open the SPL response of the transducer in enclosure on infinite baffle “Vituix VCL EM2 Scanspeak 26W8534G00 Enc IB SPL.txt ” with the ‘Half Space Response’ button.
Set Full Space to “on”.
Set Directivity to “off”.
Directivity will be investigated later in the off axis, power and directivity analysis.
Now the SPL response of the transducer in enclosure in full space is shown in the output window.
With the Export button the full space SPL response is saved as Vituix VCL EM2 Scanspeak 26W8534G00 Enc FS SPL.txt.
The domain space has no influence on the impedance. The impedance is the same as the impedance of the transducer in enclosure on infinite baffle.
With the Save button the baffle project is saved as VCL EM2 Scanspeak 26W8534G00 Enc FS.vxb.
Midrange SB15NBAC30-8
In the same way as the woofer, the SPL response of the midrange in enclosure in full space can be calculated.
The full space SPL response is saved as “Vituix VCL EM2 SB15NBAC30-8 Enc FS SPL.txt.”
Tweeter SB26ADC-C000-4
In the same way as the woofer, the SPL response of the tweeter in enclosure in full space can be calculated.
The full space SPL response is saved as “Vituix VCL EM2 SB26ADC-C000-4 Enc FS SPL.txt.”
The curves of all tranducers in enclosure in full space can be imported in the Vituix main program to be displayed, like in the charts below.
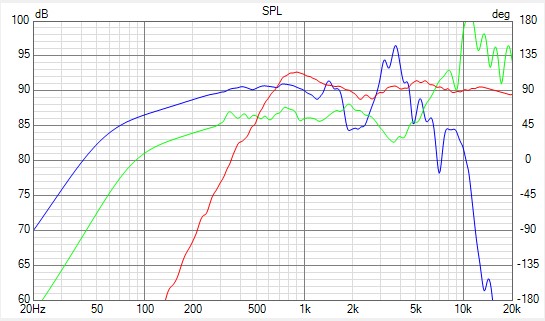
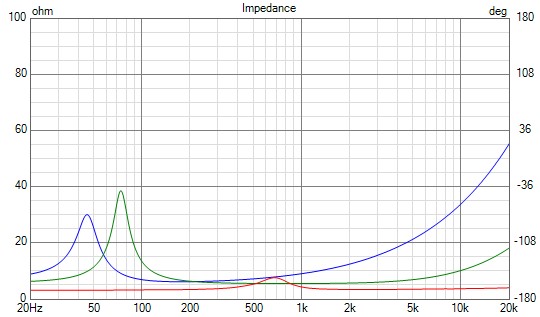
The VituixCAD project file is saved as “VCL EM2 All transducers Enc FS.vxp”
Back to top of Enclosure Design
SPL off axis – Power and Directivity Index – full space
This design part is done like described in Tech Page 18 – VCLLabs.
The VituixCAD Diffraction tool is used to calculate power response and directivity index curves.
Start (VituixCAD->Tools->Diffraction)
Woofer Scanspeak 26W8534G00
Open “vxb” baffle project “VCL EM2 Scanspeak 26W8534G00 Enc FS.vxb”
In the output window:
- set Full Space to “on”
- set Directivity to “on”
- set Vertical to “on”
- set Negative angles to “on”. If the transducer is placed not symmetric on the baffle with respect to the baffle edges, negative off axis curves have to be considered also.
- Set Feed to “on”, feed polar responses to current driver of speaker
- Set Step to “15”, off axis step on the horizontal and vertical orbits
Export to file “VCL EM2 Scanspeak 26W8534G00 Enc FS”.txt. All the on and off axis horizontal and vertical SPL responses in positive and negative 15 degrees steps are saved. The off axis degree is automatically mentioned in the file names.
Midrange SB15NBAC30-8
Open “vxb” baffle project “VCL EM2 SB15NBAC30-8 Enc FS.vxb”.
The off axis curves can be exported in the same way as the woofer and are saved as “VCL EM2 SB15NBAC30-8 Enc FS”.txt. The off axis degree is automatically mentioned in the file names.
Tweeter SB26ADC-C000-4
Open “vxb” baffle project “VCL EM2 SB26ADC-C000-4 Enc FS.vxb”.
The off axis curves can be exported in the same way as the woofer and are saved as “VCL EM2 SB26ADC-C000-4 Enc FS”.txt. The off axis degree is automatically mentioned in the file names.
All the on and the off axis responses can be imported in the Vituix main program and be displayed. It will be explained in Tech Page 19 – VCLLabs, “Preparing the crossover design in the CAD tool”.
Back to top of Enclosure Design
Crossover Design
Contents of Crossover design
- Preparing the crossover design in the CAD tool
- Crossover filter targets
- Active filter with generic filter blocks
- DSP active filter using biquads
- ASP active filter using opamp filter blocks
- Passive filter
- Low cost passive LR2 filter
Preparing the crossover design in the CAD tool
A new project is created in VituixCAD and saved as “VCL EM2 All transducers no filter.vxp”
This part of the crossover design is explained in Tech Page 19 – VCLLabs.
For this 3-way loudspeaker, 3 drivers for woofer, midrange and tweeter are created.
Driver names can be chosen. For this loudspeaker VCL EM2 the names are
- Driver #1 26W8534G00
- Driver #2 SB15NBAC30-8
- Driver #3 SB26ADC-C000-4
Connect the 3 drivers directly to the source like drawn in the schematic below.
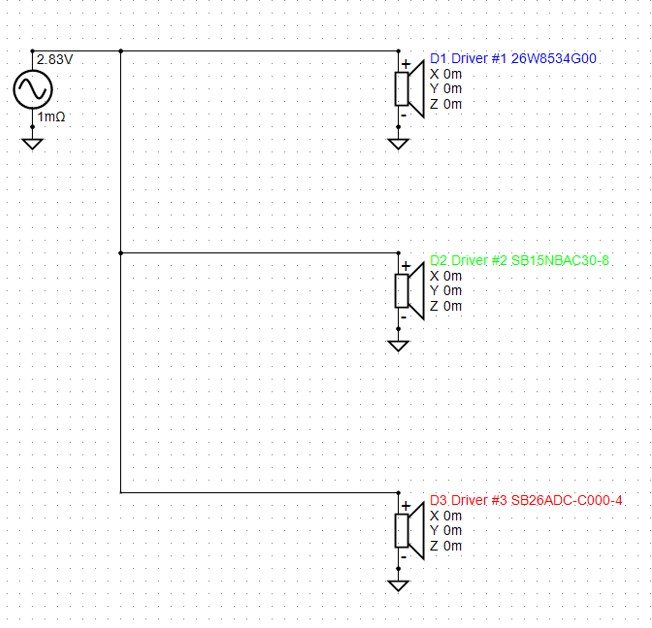
For all drivers the horizontal and vertical SPL responses 0 to + 180 and to -180 degrees of simulations (or measurements) of the transducer in enclosure in full space are imported. Also the impedance response of each transducer in the enclosure is imported.
In the VituixCAD main program, it is possible to select a response curve in a graph chart by placing the cursor on the response curve. Selecting the curve and while clicking the right mouse button, it can be saved as an overlay with “Save selected curve as overlay”.
In this way the SPL, power and DI curves of the three loudspeaker transducers can be visualized in one chart.
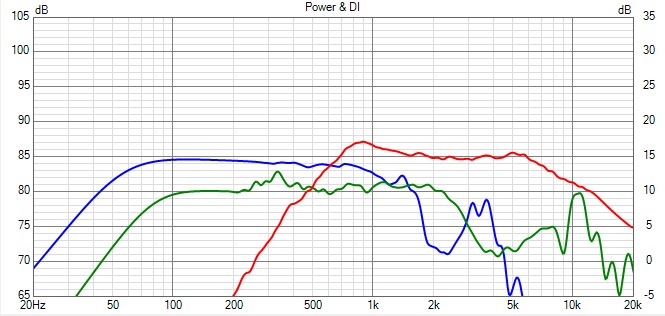
SPL response of woofer (blue), midrange (green) and tweeter (red)
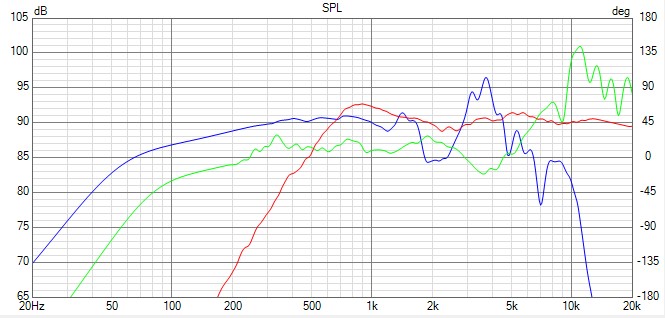
In this chart there can be observed that a loudspeaker with a sensitivity of about 83 dB and a frequency F3 = 40 Hz ( – 3 dB point) can be realized.
Power response of woofer (blue), midrange (green) and tweeter (red)
DI of woofer (blue), midrange (green) and tweeter (red)
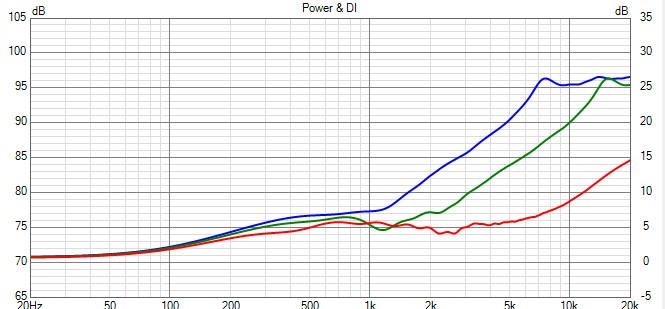
It can be observed that for crossover frequencies 250 Hz and 2500 Hz, the total DI can be kept constant at a value around 6 dB from 250 to 5000 Hz.
Back to top of “Crossover Design”
Crossover filter targets
For this loudspeaker VCL EM2 a Linkwitz-Riley 4th order crossover filter type is designed. To realize the most flat SPL, power and directivity index, the crossover frequencies are chosen at 250 Hz and at 2500 Hz.
With the chosen woofer Scanspeak 26W8534G00, that has a sensitivity of 89 dB on infinite baffle, the loudspeaker sensitivity can be designed at 83 dB and a F3 = 40 Hz in full space.
Create a new project and save the project as a “VCL EM2 Crossover filter targets LR4 250 2500.vxp”.
This part of the crossover design is explained in Tech Page 12 – VCLLabs.
Drivers TAB
Select (VituixCAD -> Drivers)
Add 3 drivers, driver #1, driver #2 and driver #3 and set the default SPL of each driver to 83 dB.
Crossover TAB
Make a schematic with filter blocks like mentioned in the figure below.
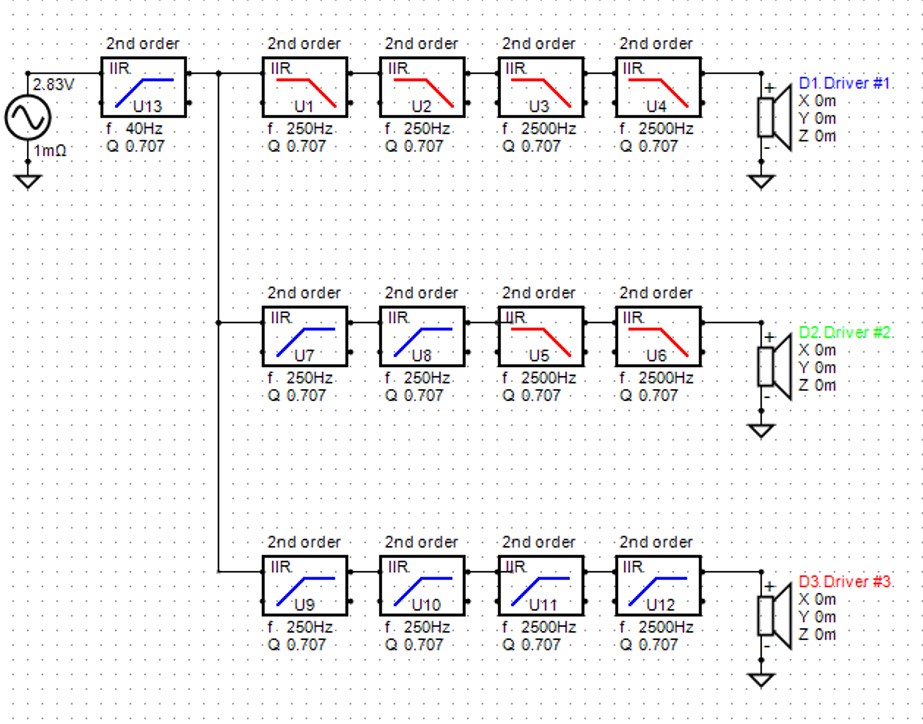
One “Active High Pass” filter block, 2nd order, f = 40 Hz, Q = 0.707 in series with the source for the F3 and low frequency target.
For driver #1, the woofer target: two “Active Low Pass” filter blocks, 2nd order, f = 250 Hz, Q = 0.707 and two “Active Low Pass” filter blocks, 2nd order, f = 2500 Hz, Q = 0.707, all in series.
For driver #2, the midrange target: two “Active High Pass” filter blocks, 2nd order, f = 250 Hz, Q = 0.707 and two “Active Low Pass” filter blocks, 2nd order, f = 2500 Hz, Q = 0.707, all in series.
For driver #3, the tweeter target: two “Active High Pass” filter blocks, 2nd order, f = 250 Hz, Q = 0.707 and two “Active High Pass” filter blocks, 2nd order, f = 2500 Hz, Q = 0.707, all in series.
The following screen is now displayed in the main program.
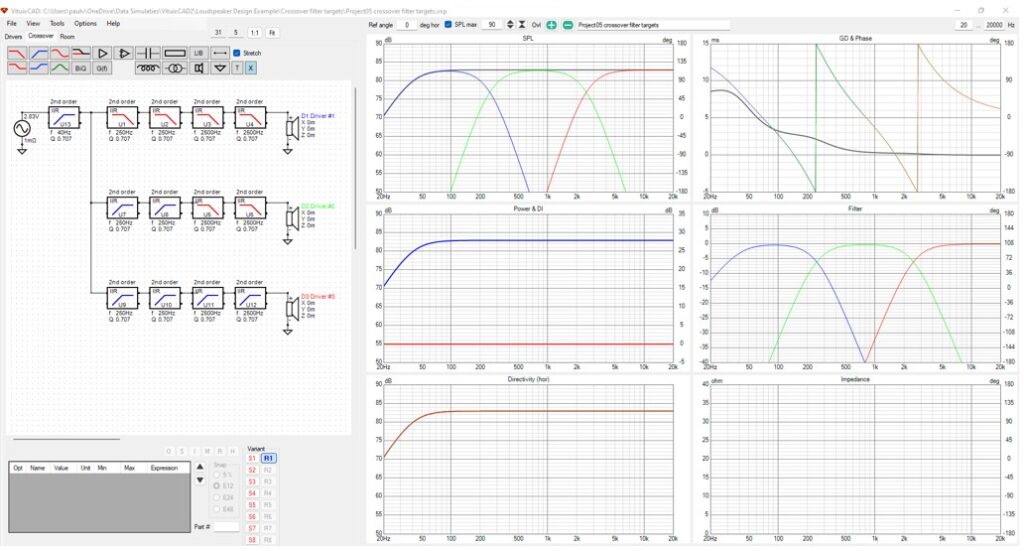
In the SPL chart, the SPL target of each driver and the sum can be observed. The sum is flat at 83 dB and F3 is 40 Hz.
In the phase chart, all the driver target phases are aligned like expected for LR4.
In the filter chart, the target transfer function of each driver crossover filter is displayed.
Select woofer driver#1 by mouse click on driver#1.
Export filter targets to text files
Select woofer driver#1 by mouse click on driver#1.
Select (VituixCAD -> File -> Export-> Frequency response of driver )
Save the woofer target as “Target wf LR4 250 2500 83 dB.txt”.
In the same way the midrange and tweeter targets can be saved as “Target mr LR4 250 2500 83 dB.txt” and “Target tw LR4 250 2500 83 dB.txt”. The 3 target curves will be used for the crossover filter design.
Back to top of “Crossover Design”
Active filter with generic filter blocks
Open project file “VCL EM2 All transducers no filter.vxp” and save it as “VCL EM2 minphase filter generic blocks.vxp”.
This part of the design is described in Tech Page 13 – VCLLabs.
A minimum phase crossover filter will be designed as it will be transformed at first to a DSP active filter. So, the acoustic centers of the drivers are set to zero.
The crossover filter targets “Target wf LR4 250 2500 83 dB.txt”, “Target mr LR4 250 2500 83 dB.txt” and “Target tw LR4 250 2500 83 dB.txt” are imported as overlays.
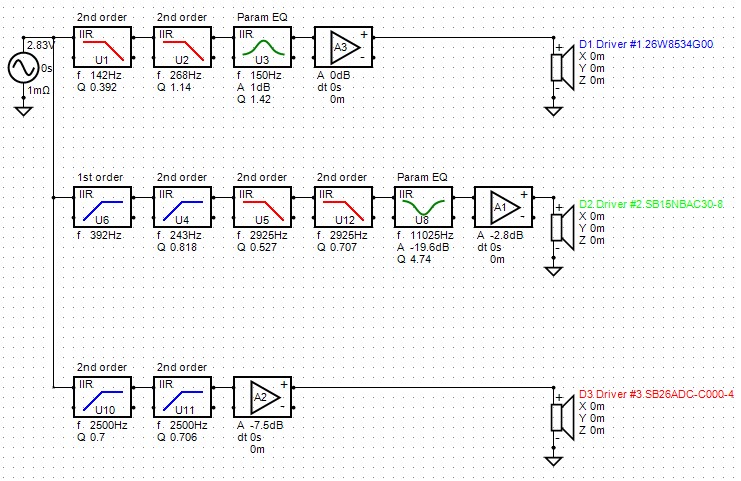
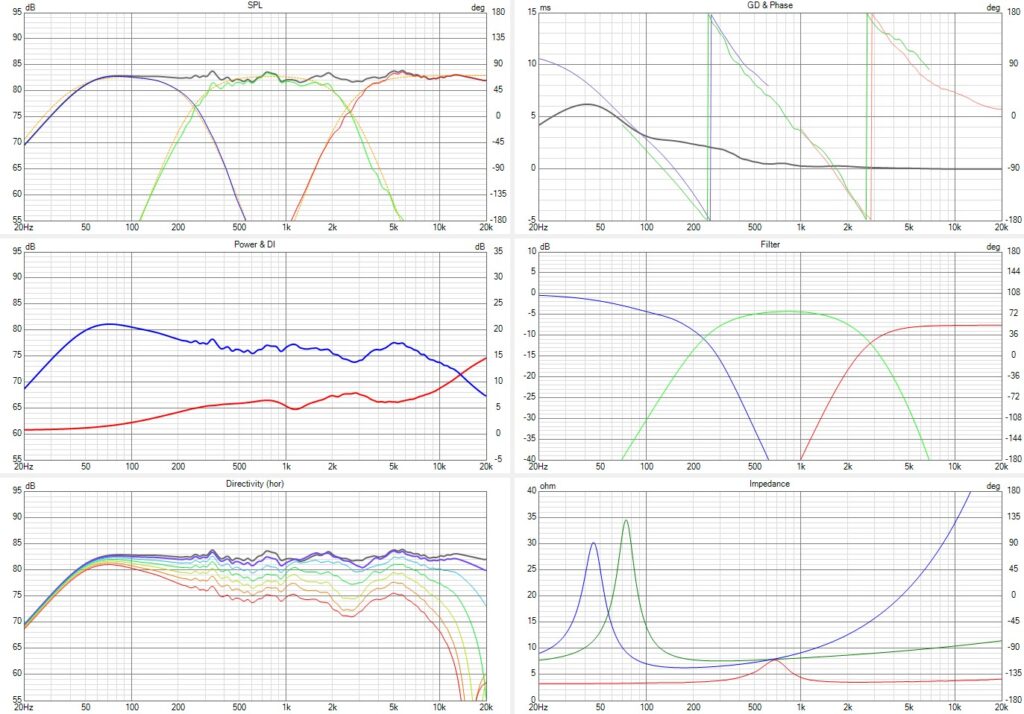
Generic filter blocks are added to get the best response of the filtered drivers on their targets.
Schematic with generic filter blocks
Charts
Back to top of “Crossover Design”
DSP active filter using biquads
This part of the design is described in Tech Page 14 – VCLLabs.
Open the VituixCAD project file “VCL EM2 minphase filter generic blocks.vxp” and save it as “VCL EM2 DSP filter miniDSP96k LR4 250 2500.vxp”.
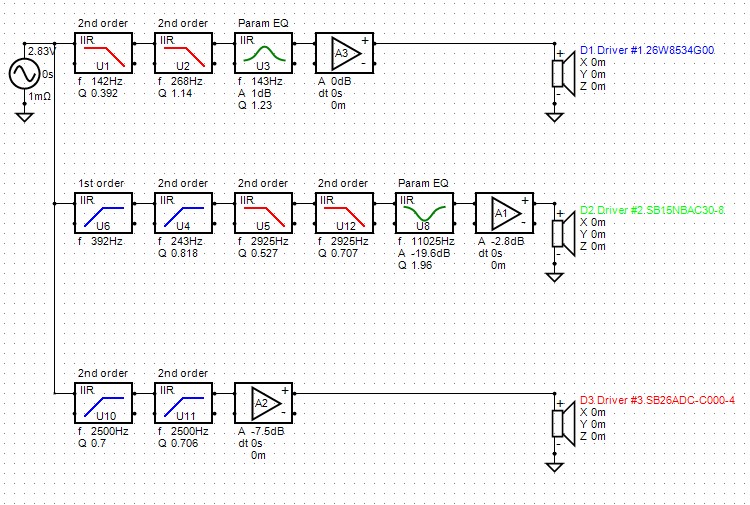
To make an miniDSP96kcrossover design, select (VituixCAD -> Options-> Frequency Responses) and set the DSP system to “miniDSP 96k”
Schematic with generic filter blocks
Charts

Biquad text files for miniDSP96k
For each filter block, a copy of the biquad coeffs can be realized and exported to a txt file.
Select a filter block with the cursor and with a right mouse click, select “Copy Biquad coeffs”.
In the pop-up window the biquad coeffs can be exported to a text file.
The woofer biquad file is saved as “VCL EM2 LR4 250 2500 woofer biquads miniDSP96k.txt”
The midrange biquad file is saved as “VCL EM2 LR4 250 2500 midrange biquads miniDSP96k.txt”
The tweeter biquad file is saved as “VCL EM2 LR4 250 2500 tweeter biquads miniDSP96k.txt”
Back to top of “Crossover Design”
ASP active filter using opamp filter blocks
This part of the design is described in Tech Page 15 – VCLLabs.
Open the VituixCAD project file “VCL EM2 minphase filter generic blocks.vxp” and save it as “VCL EM2 ASP filter opamp blocks.vxp”.
Acoustic centers setting
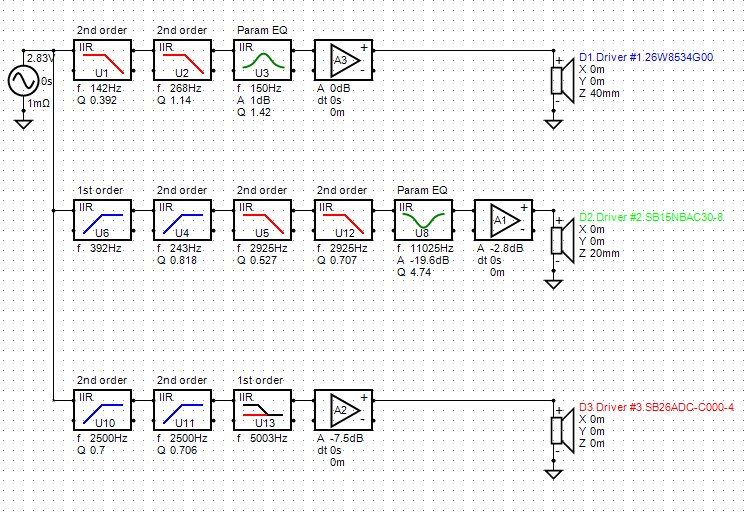
For this loudspeaker VCL EM2, the woofer acoustic center is 40 mm behind the tweeter acoustic center and the midrange is 20 mm behind.
Select each driver with the mouse and adapt the z coordinates.
Z coordinate driver #1 = 40 mm
Z coordinate driver #2 = 20 mm
Z coordinate driver #3 = 0 mm
To compensate for these acoustic center offsets, a first order all pass filter at 5 kHz is added in the tweeter filter to create some delay.
Schematic with generic filter blocks
Charts with genric filter blocks
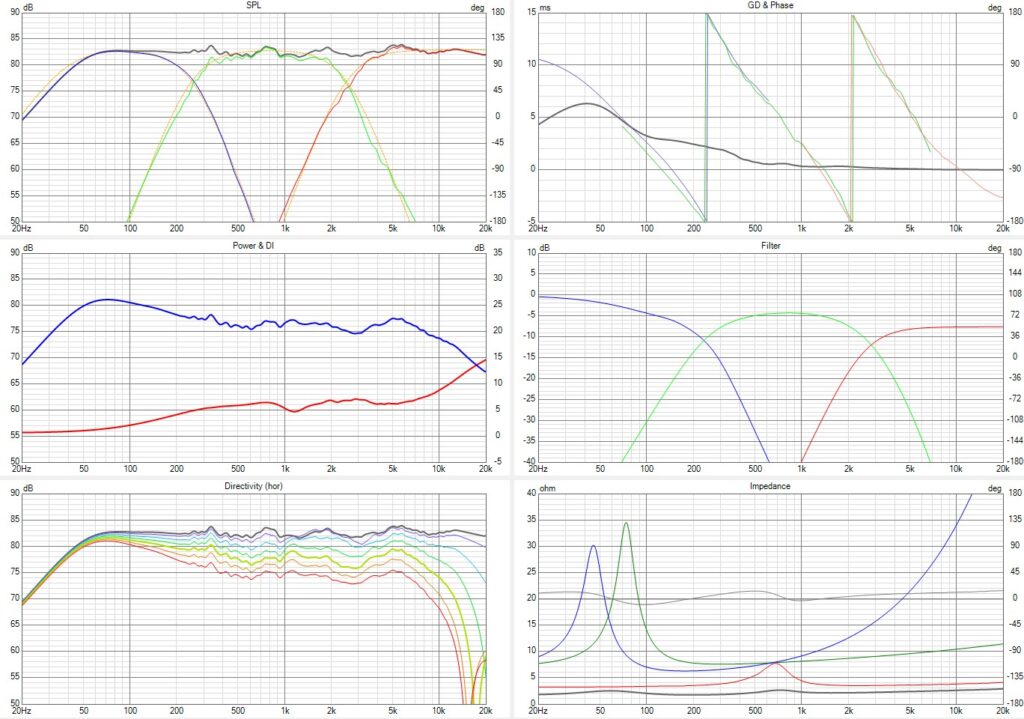
The following generic filter blocks are needed:
Woofer filter
LP2 142 Hz Q = 0.392
LP2 268 Hz Q = 1.14
BEQ 150 Hz Q = 1.42 A = 1.0 dB
gain block 0 dB
Midrange filter
HP1 392 Hz
HP2 343 Hz Q = 0.818
LP2 2925 Hz Q = 0.53
LP2 2925 Hz Q = 0.70
BEQ 11025 Hz Q = 4.74 A = -19.6 dB
gain block -2.8 dB
Tweeter filter
HP2 2500 Hz Q = 0.70
HP2 2500 Hz Q = 0.70
AP1 5000 Hz
gain block -7.2 dB
Schematic using the VCLLabs opamp filter blocks
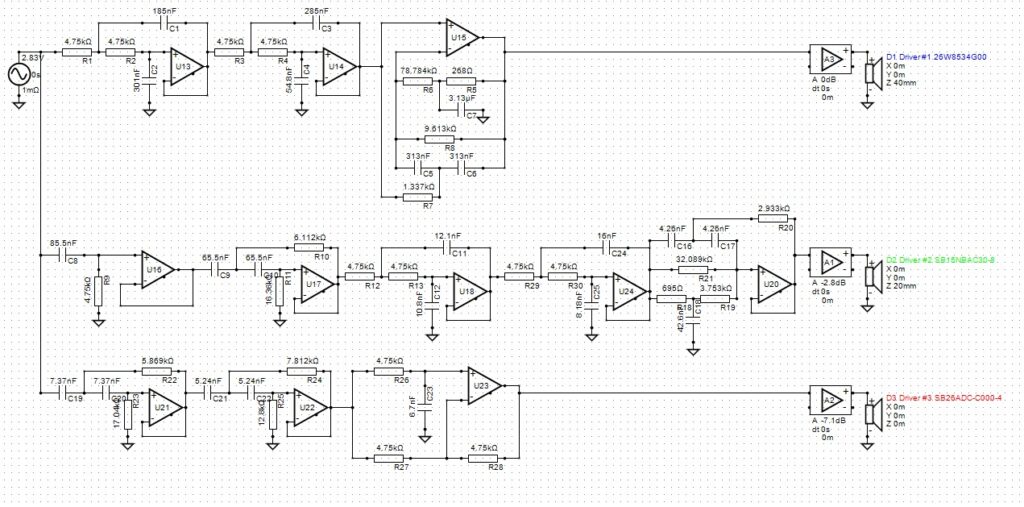
Charts with VCLLabs opamp filter blocks

Back to top of “Crossover Design”
6. Passive filter
Open project file “VCL EM2 All transducers no filter.vxp” and save it as “VCL EM2 passive filter LR4 250 2500.vxp”.
The passive filter design is described in Tech Page 16 – VCLLabs.
A passive filter, in most cases, is a non-minimum phase crossover filter. The acoustic centers offsets of the drivers must be set to their values.
The crossover filter targets “Target wf LR4 250 2500 83 dB.txt”, “Target mr LR4 250 2500 83 dB.txt” and “Target tw LR4 250 2500 83 dB.txt” are imported as overlays.
Passive components are added to get the best response of the filtered drivers on their targets.
Acoustical center settings
The woofer acoustic center is 40 mm behind the tweeter acoustic center and the midrange is 20 mm behind.
Select each driver with the mouse and adapt the z coordinates.
Z coordinate driver #1 = 40 mm
Z coordinate driver #2 = 20 mm
Z coordinate driver #3 = 0 mm
Passive filter schematic
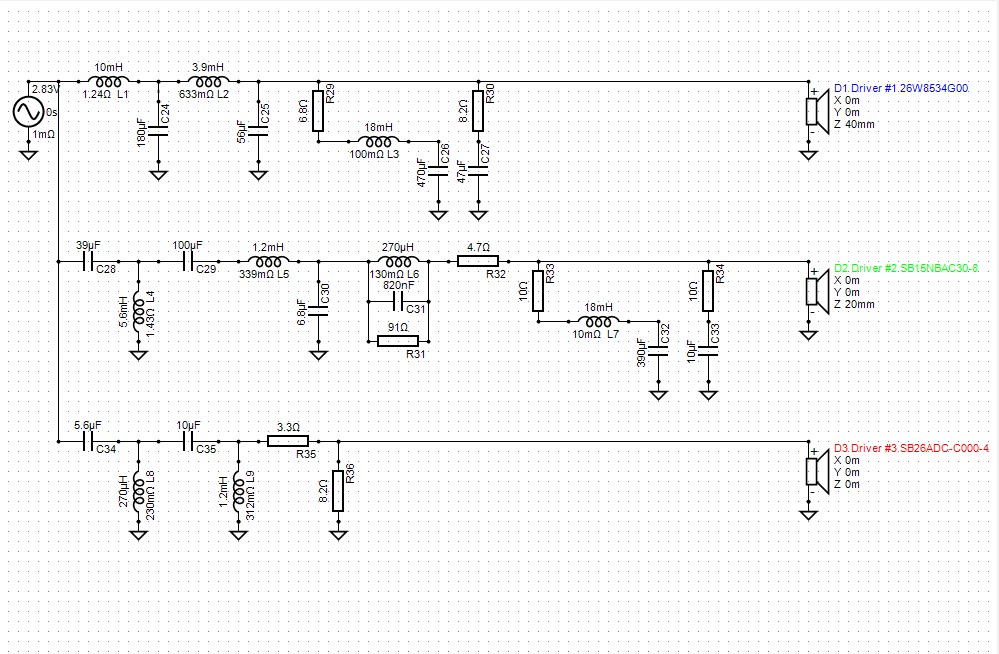
Charts
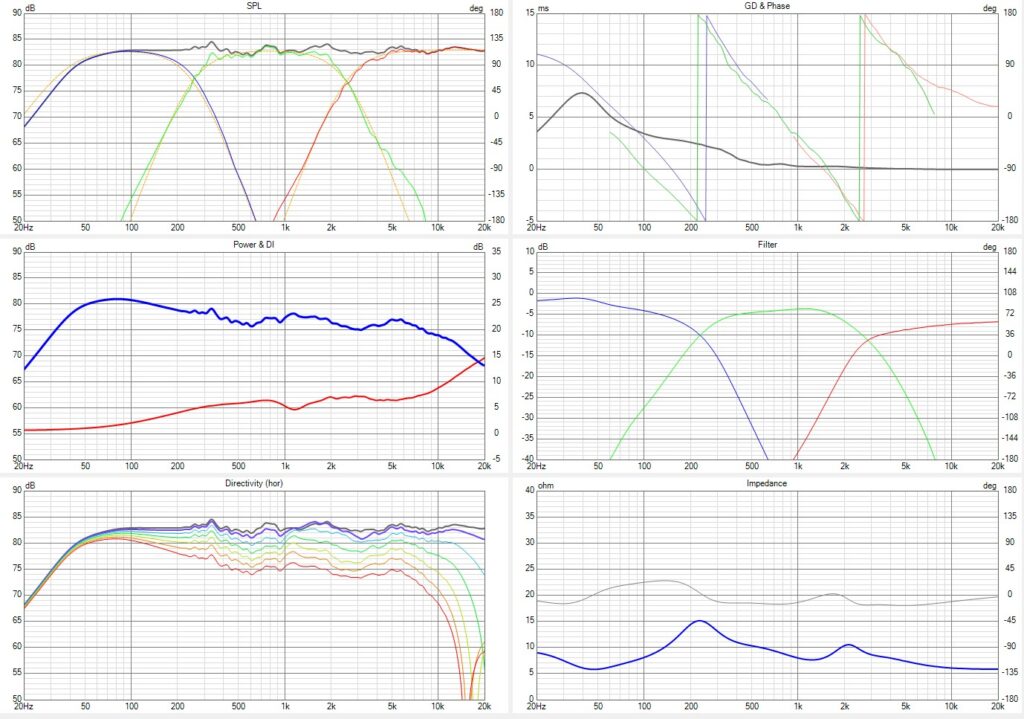
Back to top of “Crossover Design”
7. Low cost passive LR2 filter
This is a low cost Linkwitz-Riley LR2 at 250 and 2500 Hz.
For this design, the number of components is reduced, but the responses still are on target as good as possible.
Crossover filter schematic @ VCL EM2 LR2 250 2500 Hz
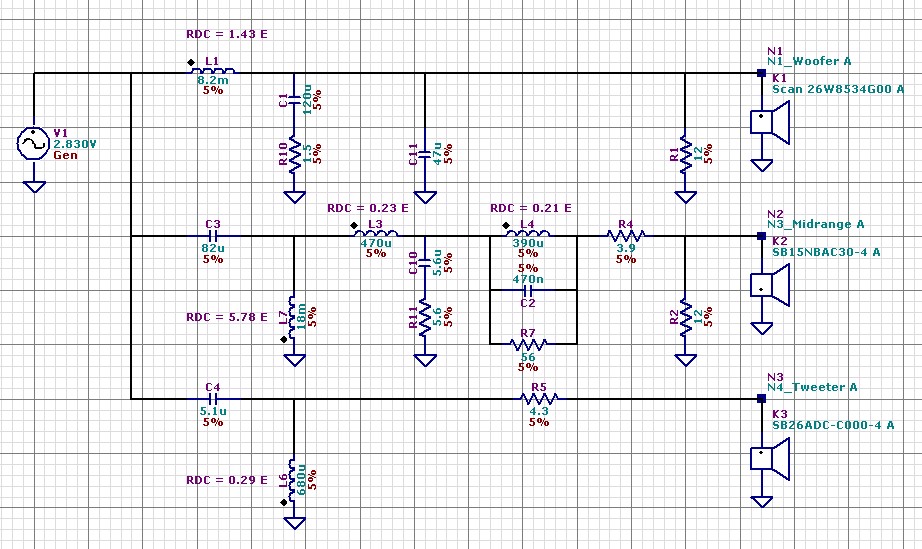
For the components choice it is important to choose the same DCR value for all coils as mentioned in this schematic.
SPL on axis of the filtered drivers and the sum at 1m, 2.83 Vrms @ VCL EM2 LR2 250 2500 Hz
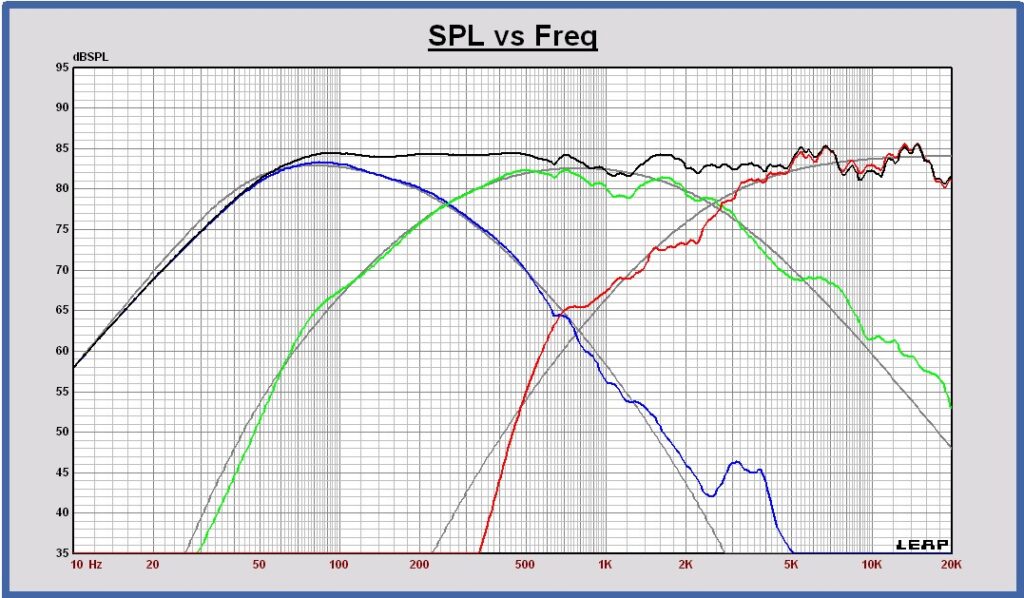
Phase response of the filtered drivers and the sum in free space at 3m @ VCL EM2 LR2 250 2500 Hz
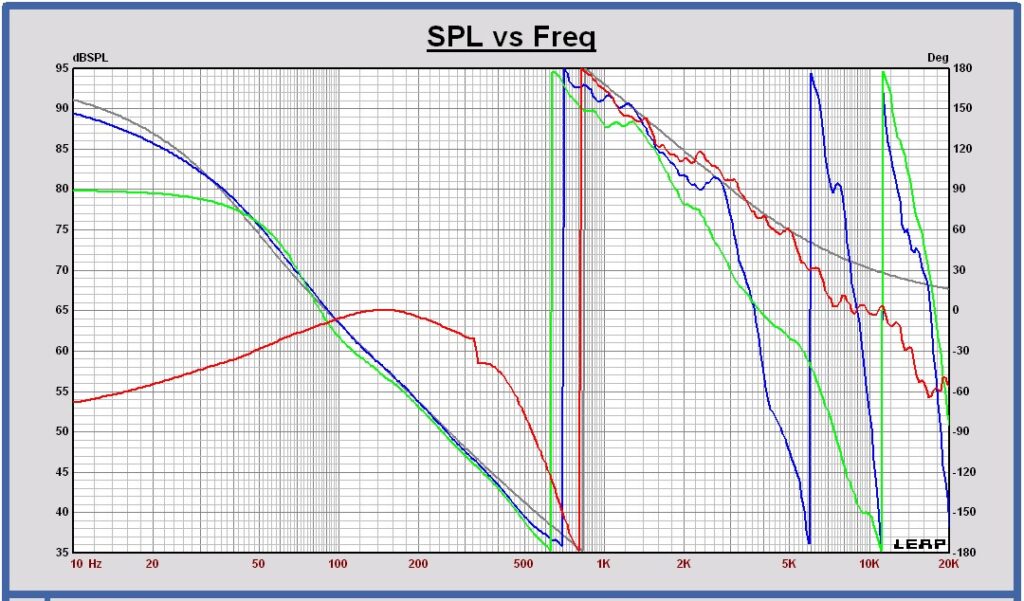
Impedance at the input of the filter @ VCL EM2 LR2 250 2500 Hz
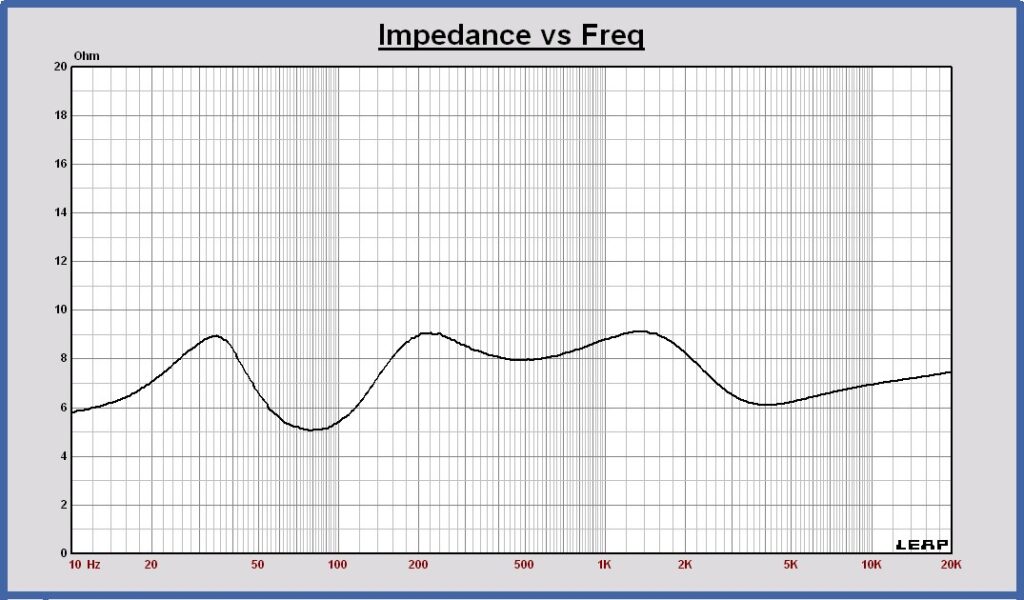
Back to top of Crossover Design
Acoustical and electrical measurements
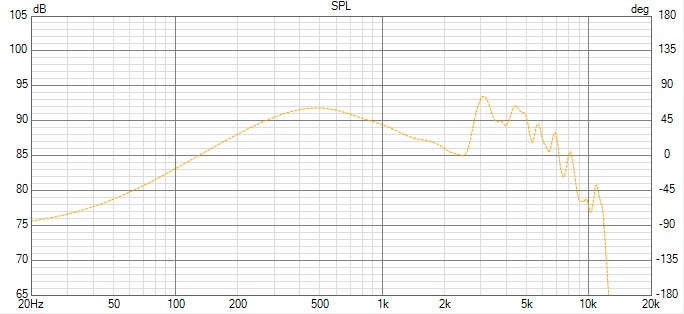
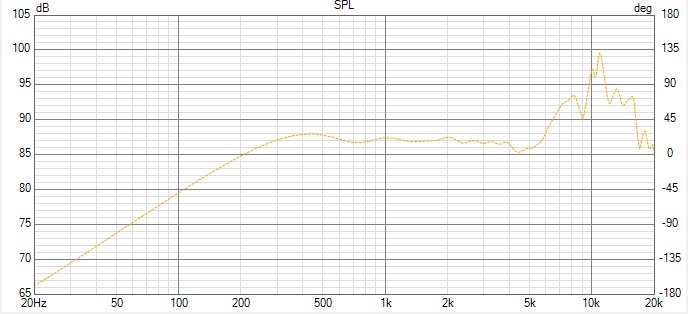
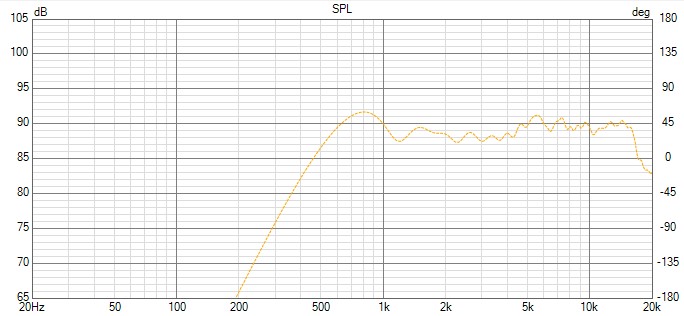
Indoor acoustical GP (groundplane) measurements at 2m of the VCL EM2 have been done. GP measurements have the same SPL as the transducer placed in full space at 1m.
For these indoor measurements GP at 2m, the reflection free window for FFT was only 2ms. That is very poor, it would be better to do these measurements outdoors or in a large indoor room. But to explain the idea of designing and to measure the SPL levels, it is already interesting to consider.
The results are compared with the VituixCad simulations of the transducers in the enclosure in full space.
Merging of SPL curves is done. The low frequency part of the simulations and the high frequncy part of the measurement will be merged.
The merged curves are used to do a crossover design update.
1. SPL Measurements charts
woofer GP on axis 2m 2.83Vrms
midrange GP on axis 2m 2.83Vrms
tweeter GP on axis 2m 2.83Vrms
2. Measurements compared with the VituixCad simulations
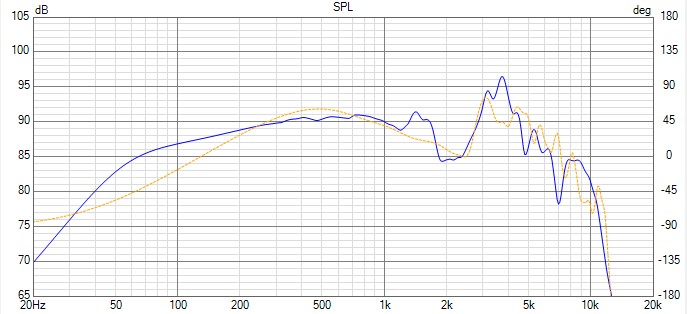
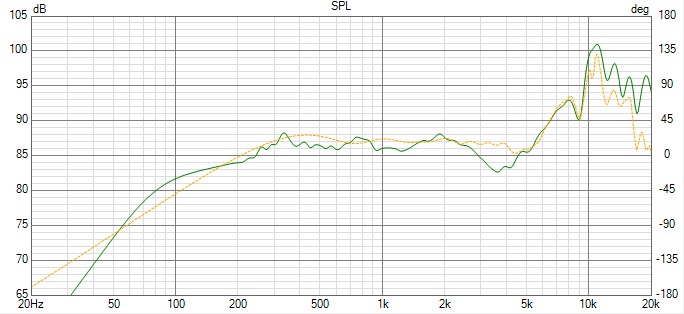
woofer GP on axis 2m 2.83Vrms (yellow) and Vituix simulation of transducer in enclosure in full space
midrange GP on axis 2m 2.83Vrms (yellow) and Vituix simulation of transducer in enclosure in full space
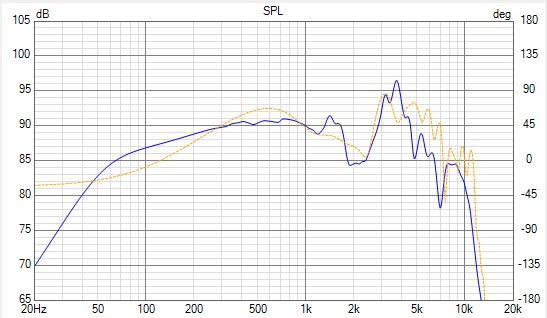
tweeter GP on axis 2m 2.83Vrms (yellow) and Vituix simulation of transducer in enclosure in full space
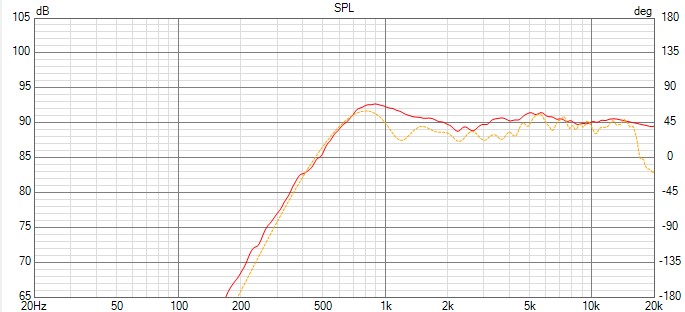
Comparing the measurements with the simulations, considering the SPL level first.
The woofer levels seems to be the same.
The midrange level of the simulation is about 1 dB too low.
The tweeter level of the simulation is 1 dB too high.
Comparing the level shapes. Since the reflection free FFT window is only 2 ms in this measurement, only measurements above 500 Hz can be assumed to be correct.
Measurements in full space at 1m, simulations in Leap and measurements of other loudspeakers in the past with comparable enclosure width and driver size showed a similar bafflestep response like showed in the groundplane measurement around 500 Hz.
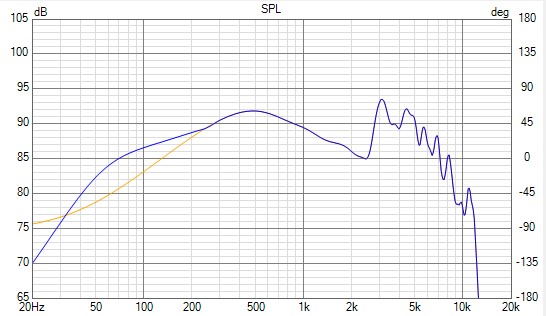
In the chart below the woofer full space SPL on axis at 1m 2.83Vrms (yellow) and Vituix simulation of transducer in enclosure in full space.
The full space measurement almost shows the same response as the ground plane measurement.
3. Merging SPL measurements and simulations
Merging of low frequency simulations and high frequency measurements can be done.
In this example:
– merging is done at 250 Hz
– low frequency simulated level of woofer is set the same in the merger tool
– low frequency simulated level of midrange is set +1 dB higher in the merger tool
– low frequency simulated level of tweeter is set – 1dB lower in the merger tool
Decreasing the merging frequency would be more correct, but then measurements with a wider reflection free FFT window are needed, to be done in a larger indoor room or outdoors.
Woofer merged SPL at 250 Hz and the woofer measurement (yellow)
Midrange merged SPL at 250 Hz and the midrange measurement (yellow)
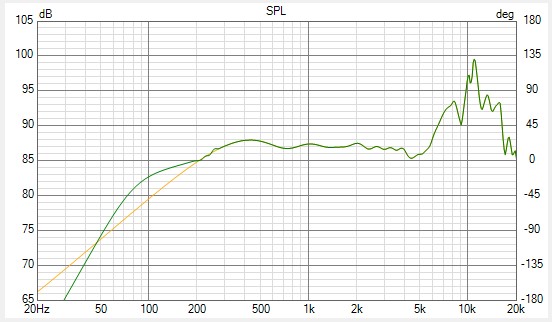
Tweeter merged SPL at 250 Hz and the tweeter measurement (yellow)
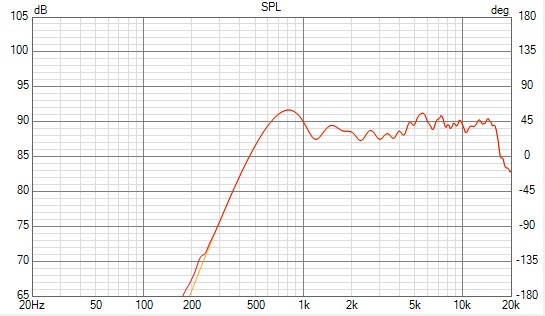
These merged SPL curves can be used to update the crossover filter design.
4. Impedance measurements
In the chart below the impedance measurement of all transducers in the enclosure (yellow color), together with the VituixCad simulation results of all impedances of the transducers in enclosure.
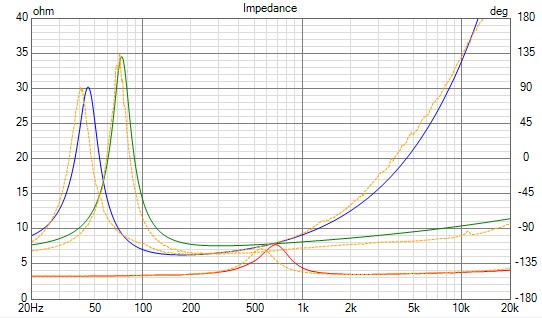
Comparing the impedance measurements and simulations, the resonance impedance peak frequencies of the woofer and midrange are a little different. It will cause a little SPL difference. In a second simulation run, such differences can be solved by adapting the enclosure parameters.
For the passive filter crossover design, it is recommended to use the measured impedance curves.
Back to top of “Crossover Design”
